
Welcome to tutorial one of your Data Analytics for Beginners Course! It’s great to have you on board 😃
Over the course of five tutorials (starting now), you’ll take on the role of a data analyst and work with a real dataset to solve a business challenge. By the end of the course, you will:
- Be familiar with all the key steps in the data analysis process
- Understand, and be able to apply, some fundamental analysis techniques
- Have a first-hand glimpse of what it’s like to work as a data analyst
- Learn how AI is impacting the data industry and explore some AI tools and technologies that can help data analysts
So how does it work, and what’s in store?
This free short course consists of five tutorials (starting with this one). Each tutorial will introduce a key data analytics topic before taking you through a practical exercise. This is a very hands-on course, so be prepared to get stuck in!
In this tutorial, we’ll focus on setting the scene, introducing the field of data analytics and exploring what a data analyst actually does. We'll then take a look at whether data analysts are in demand, as well as the average data analyst salary💰 From there, we’ll lay out the business challenge you’ll seek to solve throughout the course and have you open up your dataset—ready for some real hands-on exercises in tutorial two.
Sound good? Here’s the breakdown of our tutorial one agenda:
- What is data analytics?
- What does a data analyst do?
- Are data analysts in demand, and what’s the average data analyst salary?
- Getting ready: What tools do you need for this course?
- Practical exercise: Opening your dataset
- Key takeaways and further reading
If you have questions or feedback along the way, simply reply to any of the course emails you receive. We'll be happy to hear from you 😊
Are you ready to begin your excursion into the fascinating world of data analytics?
Let’s go! 🚀
1. What is data analytics?
First things first: What exactly is data analytics?
If we had to sum it up in a single sentence, we’d say it’s the process of analyzing raw data in order to draw out meaningful, actionable insights. It’s a form of business intelligence, enabling companies and organizations to make smart decisions based on what the data is telling them.
Data analytics encompasses the extraction (or collection) of raw data, the preparation and subsequent analysis of that data, and storytelling—sharing key insights from the data, using them to explain or predict certain scenarios and outcomes, and to inform decisions, strategies, and next steps.
Does that all sound a bit abstract? Let’s bring it to life with an example.

Imagine you’re a data analyst working for a public transport network—think MTA in New York City, or TFL in London. There’s a major sporting event coming up in the city, and you know that people will be flying in from all over to attend.
In order to avoid absolute chaos, you need to adapt the usual public transport schedule to accommodate for this influx of people and increase in travel throughout the city. How do you plan ahead with accuracy? 🤔
You guessed it…data analytics! You analyze data from similar events that have happened in the past and use it to predict the number, frequency, and types of journeys that are likely to occur around this event. With these insights, you’re able to ensure that public transportation continues to run smoothly 🚌
As you can see, data analytics replaces guesswork with data-driven insights. It helps you make sense of the past and predict future trends and behaviors, leaving you much better equipped to make smart decisions.
If you'd like to learn in video form, allow our colleague will to talk you through what it is"
You’ll find a more comprehensive explanation of what data analytics is in this guide, and it’s also worth reading up on the four different types of data analysis. For now, though, let’s explore the role of the data analyst.
2. What does a data analyst do?
As a data analyst, it’s your job to turn raw data into meaningful insights.
Any kind of data analysis usually starts with a specific problem you want to solve, or a question you need to answer—for example, “Why did we lose so many customers in the last quarter?” or “Why are patients dropping out of their therapy programs at the halfway mark?”
To find the insights and answers you need, you’ll generally go through the following steps: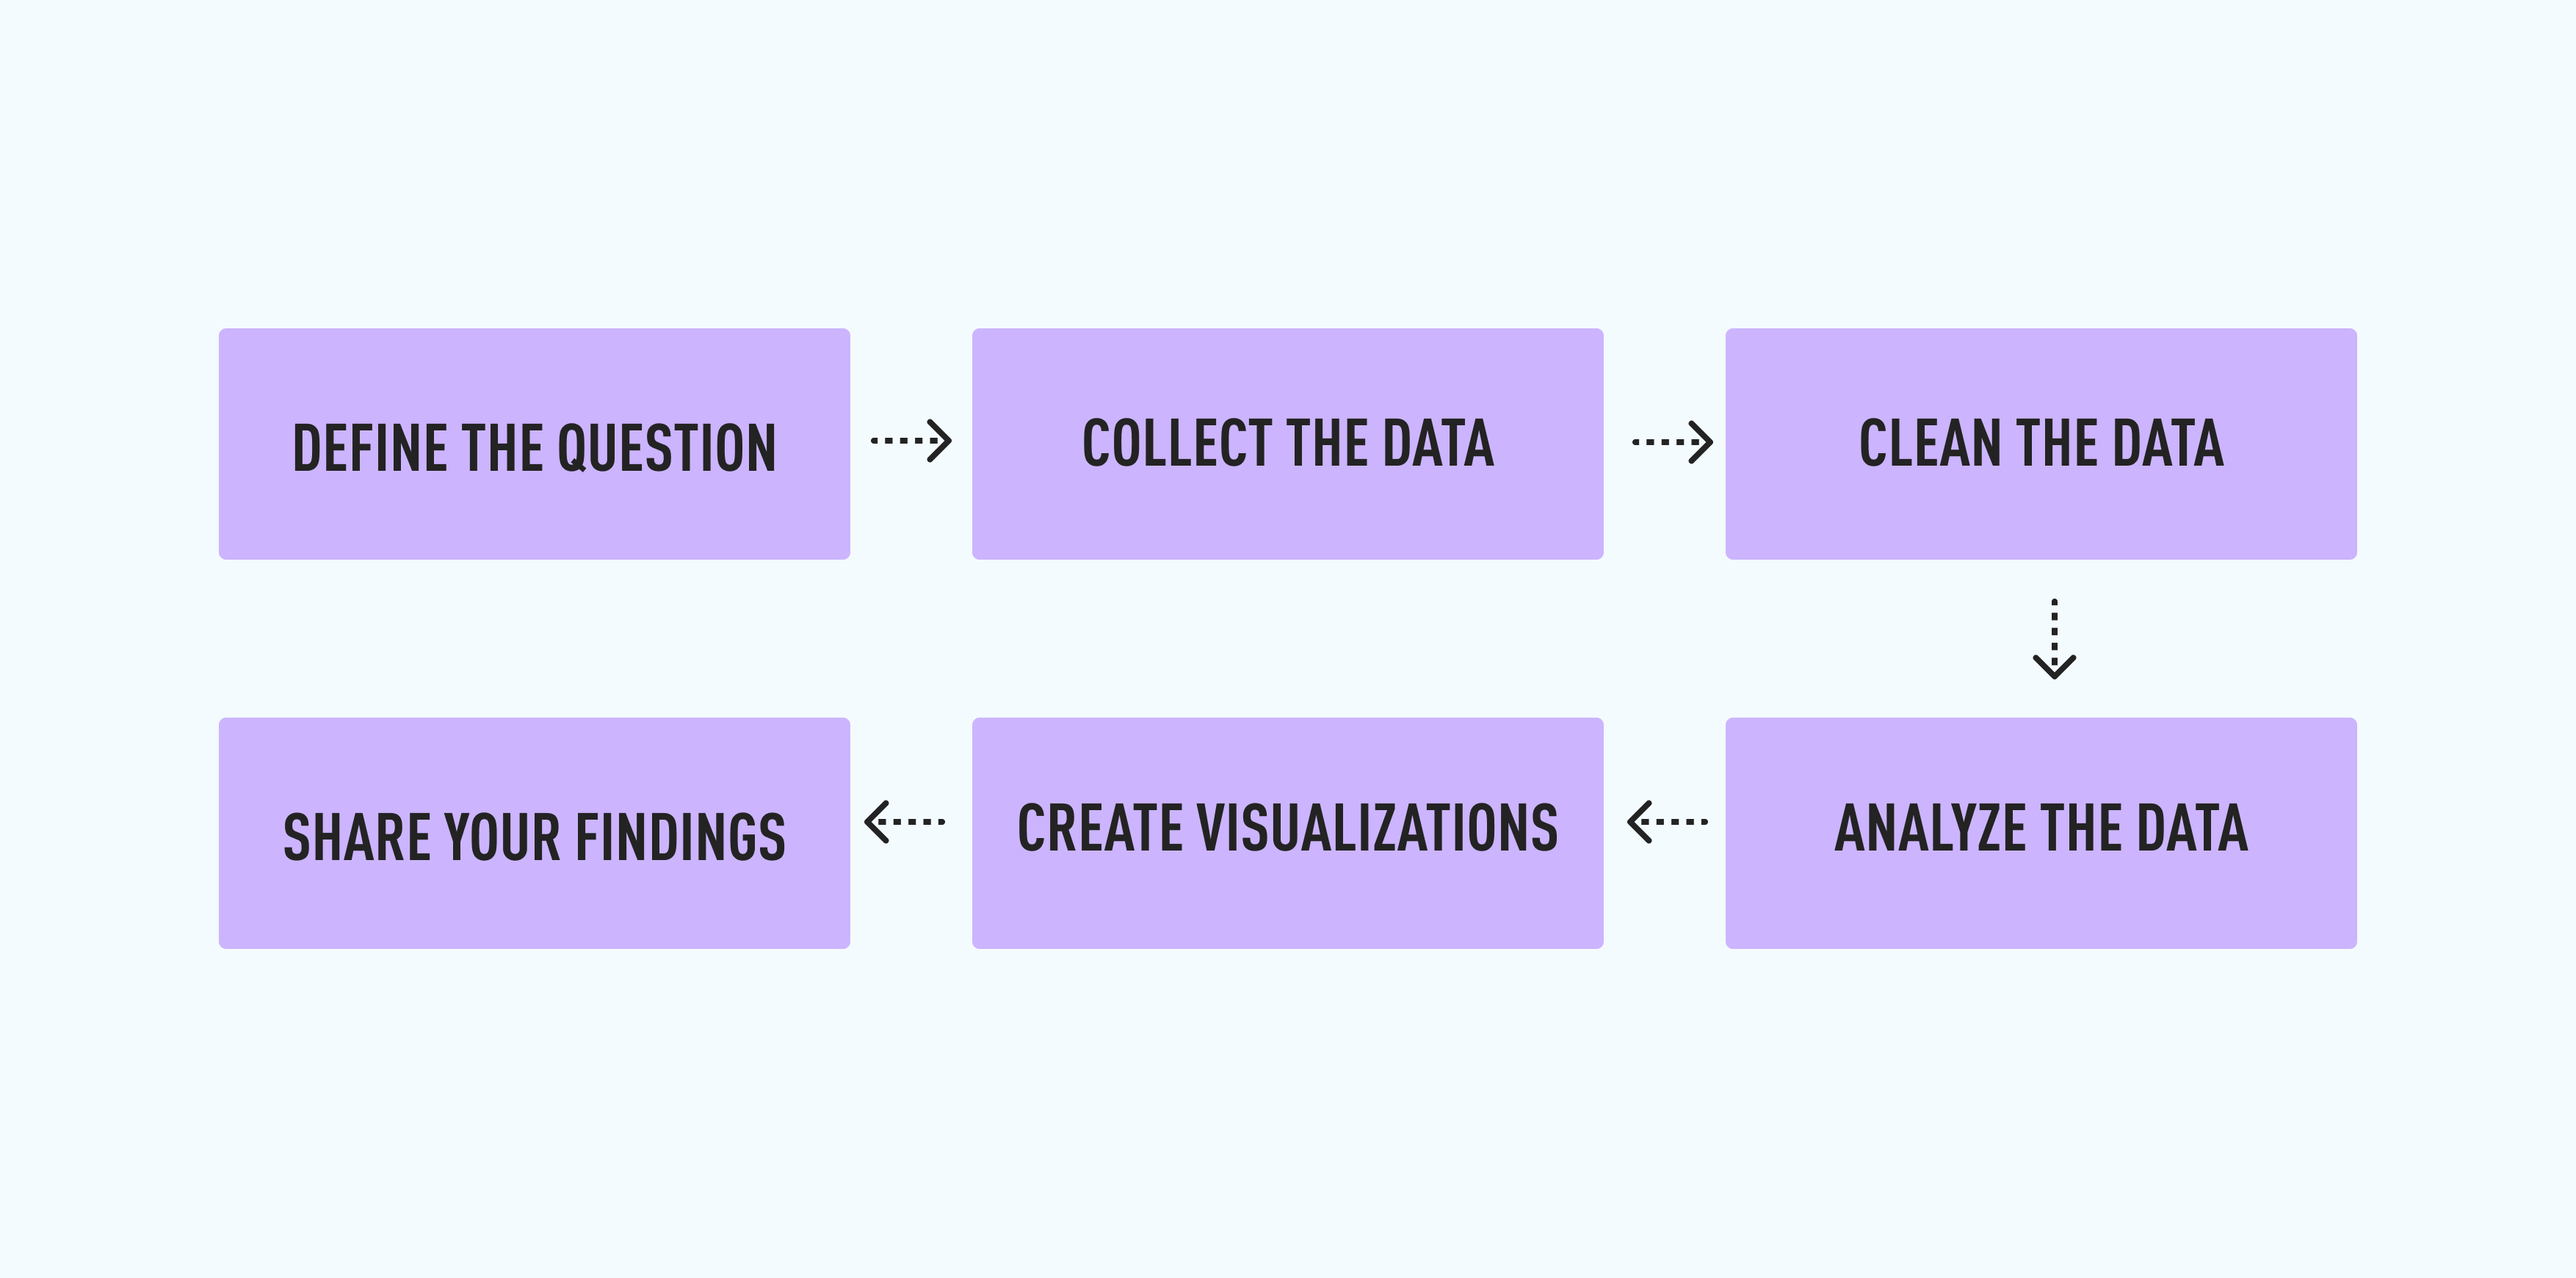
-
Define your question or problem statement
-
Collect the necessary raw data
-
Clean the data so that it’s ready for analysis
-
Analyze the data
-
Create visualizations
-
Share your findings
At each stage, data analysts use a range of different tools—such as Microsoft Excel for data wrangling and Tableau for data visualizations. We explain each step in more detail in our guide to the data analysis process, and you’ll apply it first-hand throughout this course 😊
But the role isn’t just limited to a single process. As a data analyst, you occupy a very critical position; you’re the bridge between incomprehensible raw data and useful insights, empowering people in all areas of the organization to make smarter decisions and ultimately reach their goals. As such, you’ll work closely with managers, product owners, and department leads to identify goals, prioritize needs, and shape strategies.
And, in addition to actually analyzing data, you may also be responsible for building databases and dashboards, ensuring data quality and best practices, and maintaining relevant documentation.
Of course, the exact tasks and responsibilities will vary depending on where you work. To learn more about what a data analyst does, we recommend browsing data analyst jobs on sites like Indeed, LinkedIn, and Glassdoor, as well as checking out this interview with Radi, a data analyst who works at a rare disease research and diagnosis company.
3. Are data analysts in demand, and what is the average data analyst salary?
So far, we’ve looked at what data analytics is and how this translates into the day-to-day tasks of a data analyst.
Now let’s zoom out again and consider data analytics as a career path. If you do pursue a career as a data analyst, what kinds of industries and companies might you work for? Is this a secure career choice with high demand? And what kind of salary can you expect? Let’s take a look 👀
Where can data analysts work?
When you think of data analysts and the companies that hire them, names like Meta (Facebook), Netflix, and Spotify might spring to mind. It’s the big tech companies that rely most heavily on data, right?
Not necessarily. The truth is, data analysts work anywhere and everywhere. They are critical to almost any kind of organization and industry you can think of—from large corporations to fledgling startups, from financial institutions to government, healthcare, and non-profit organizations. Wherever data is being collected (and that’s pretty much everywhere these days!), there’s a need for data analysts.
If you’re considering a career in the field, you’ll find that your skills are needed everywhere. That’s one of the great things about the job: you’re not limited to a specific sector or type of company. Once you’re a qualified data analyst, the world really is your oyster 🤩
For a closer look at where a career in data might take you, check out our round-up of the top industries hiring data analysts right now, or this guide to some of the most common data analytics job titles.
Are data analysts in demand?
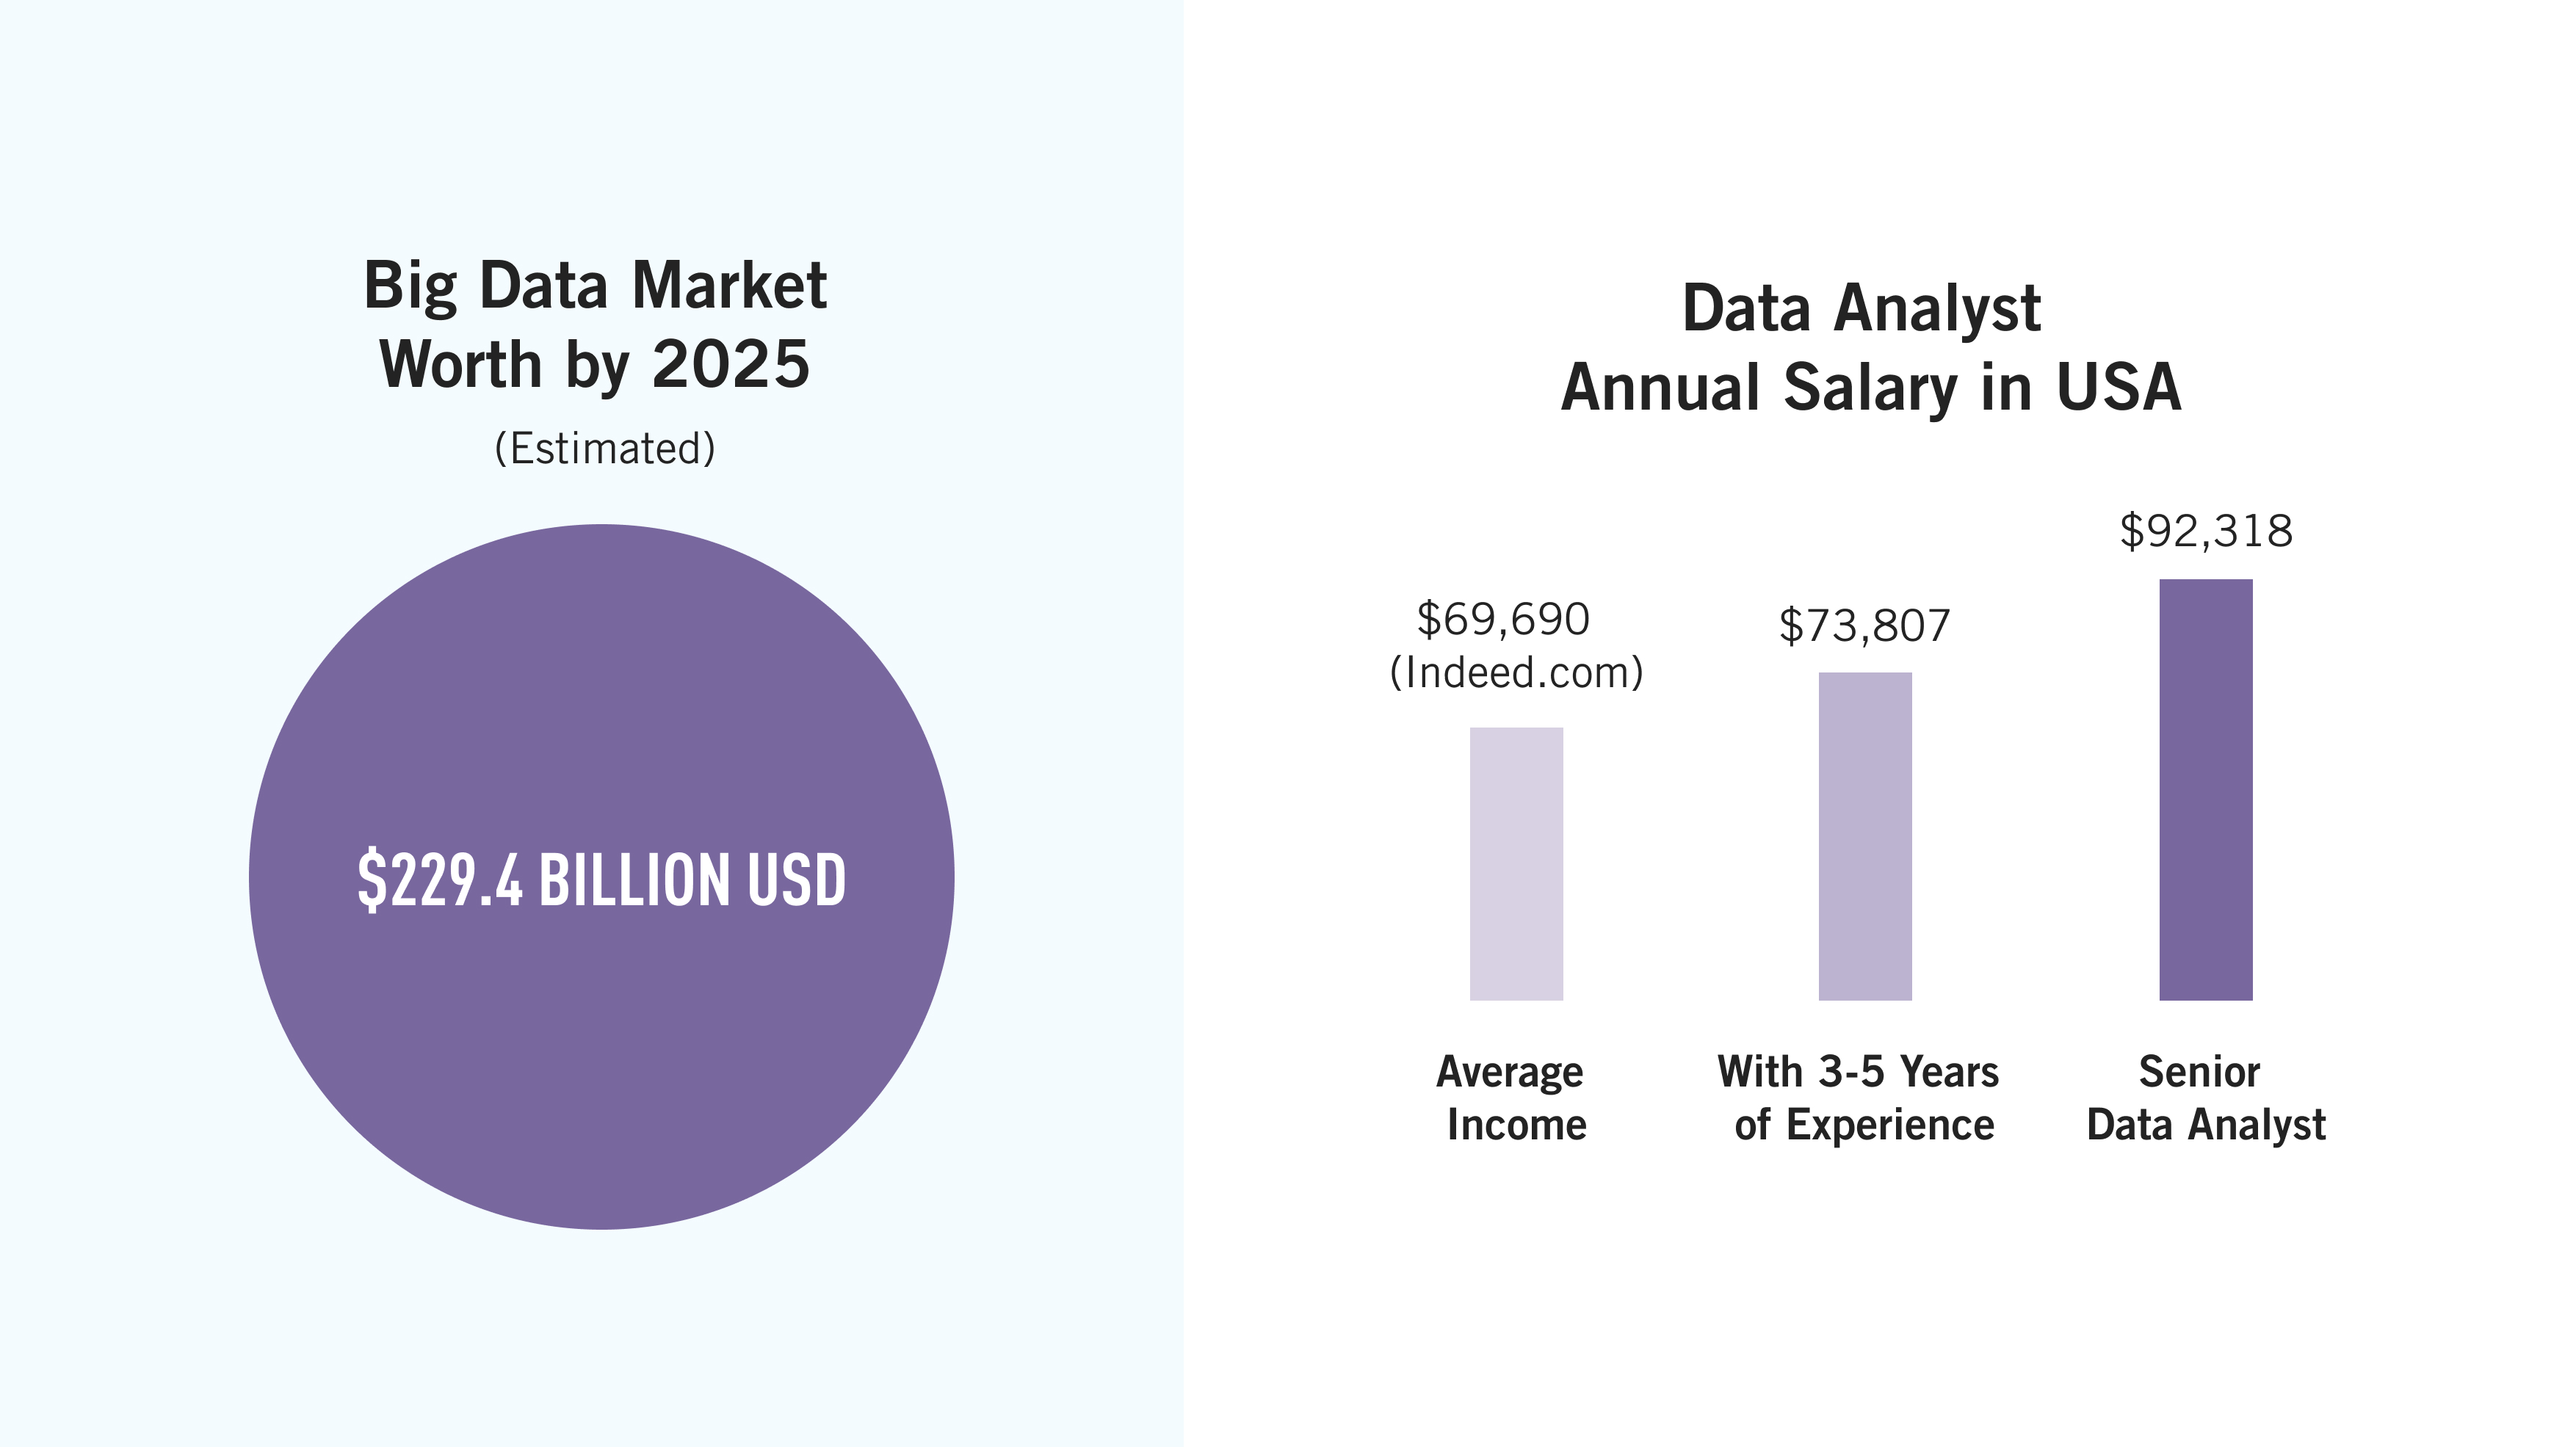
So data analysts can work pretty much anywhere, but are they in demand? In a word, yes. The big data market is growing rapidly and exponentially—it’s estimated that, by 2025, it will be worth a whopping $229.4 billion USD. The more data we generate, the more we rely on data analysts to make sense of that data. Unsurprisingly, this general growth in data is mirrored in the job market.
The Jobs of Tomorrow report published by the World Economic Forum in 2020 identifies data and artificial intelligence (AI) as one of seven high-growth emerging professions, showing the highest growth rate at 41% per year.
In 2023 the rolling out of generative AI products like the large language models ChatGPT and Google's Bard took a lot of industries by surprise with their possibilities, but data is the one poised to take the most advantage of it. If you want to learn more about the possibilities of AI on the industry, check out these:
- CareerFoundry's Senior Data Scientist Tom talks you through How AI Will Change Your Life
- Our Guide to the Top AI Data Analysis Tools Currently Out There
- Interview: Beyond the Buzzword – Understanding the Ethical Implications of AI
And, if you research the most in-demand tech skills for 2024 and beyond, you’ll find that data analytics crops up time and time again. Still not convinced? Take a look at this recent report about how the lack of these skills is such a global issue it's got its own title—the Data Skills Gap.
We won’t bombard you with any more statistics 🙊 Suffice it to say that data isn’t going anywhere, and nor is the need for data analysts. For a more detailed look at the demand for data analysts in your area, we recommend searching for data analyst jobs and filtering by location.
It’s also important to consider the remote job market, a topic we’ve covered extensively in this guide: Can data analysts work remotely? A closer look at the remote data analytics job market.
What is the average data analyst salary?
If you’re considering a career in data, you’ll want to know how much you could earn.
Of course, your earning potential will vary depending on where you work, your level of experience, and your exact job title. But, to give you a ballpark figure, the average data analyst salary in the United States comes in at $76,763 per year (correct at the time of writing—check the Indeed salary portal for the most up-to-date figures).
Once you’ve gained 3-5 years’ experience, this average climbs to $81,298 per year. Type in “senior data analyst” and you'll see an average yearly salary of $96,544 💸
As you can see, the earning potential for data analysts is relatively high. So, in addition to variety, impactful work, and job security, you can also count on a reasonable salary, too. For more salary insights, check out the following:
- The ultimate entry-level data analyst salary guide
- The industries currently paying the highest data analyst salaries
- The complete business analyst salary guide
We hope the first half of this tutorial has got you excited about the journey ahead, and about your potential new career as a data analyst 😃 We did promise you’d be getting hands-on with data, so let's get you set up with the tools you’ll need from here on out.
4. What tools do you need for this course?
In real life, data analysts work with a whole host of tools. But, for the purpose of this course, you’ll be working with Google Sheets and, a little bit later on, Google Slides.
You’ll access the dataset and carry out all your analysis in Google Sheets. You’ll then use Google Slides to create a presentation deck in order to summarize and present the findings of your analysis.
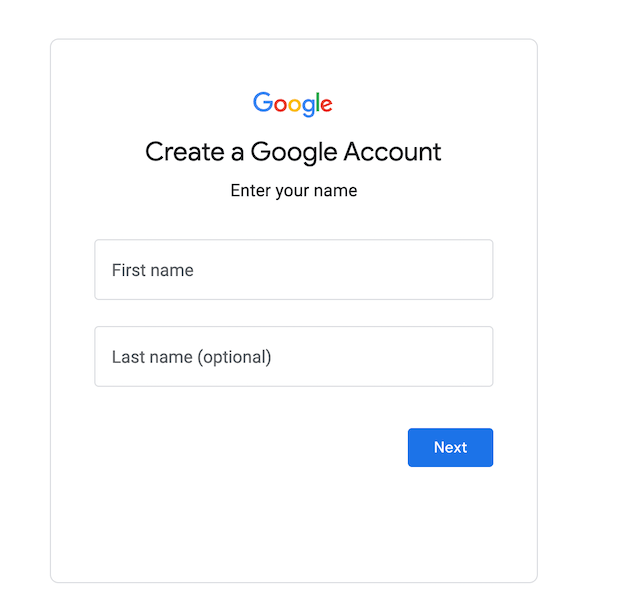
You can access both Google Sheets and Slides for free with a Google account (which you have if you use Gmail!), and you don’t need to download anything, so it shouldn’t take you long to get set up. We’ll show you how to create a gmail account in the next section.
5. Practical exercise: Defining the challenge and opening your dataset
First things first: Let’s get you acquainted with your dataset, which you’ll access in Google Sheets.
If you already have a Google account, you’re good to go! If you don’t yet have one, you can quickly and easily create one. Simply follow the instructions on the sign-up screen.
Are you all set up with your Google account? Great! Now it’s time to get into character. For the duration of this course, you’ll take on the role of a data analyst working at Citi Bike—New York City’s official bike-sharing system. Ready? Let’s set the scene 🎬
Citi Bike is the largest bike-share program in the United States, with 20,000 bikes and over 1,300 pick-up stations across Manhattan, Brooklyn, Queens, the Bronx, and Jersey City. As stated on their website, the service was designed for quick trips with convenience in mind, offering a fun and affordable way to get around town. Users can sign up for annual membership, or buy a short-term pass through the Citi Bike app. Once they’ve joined, they simply locate a nearby bike, ride around as they please, and return it to a nearby station once they’re done 🚴

Like most organizations, Citi Bike is constantly looking for ways to improve their business model and provide an even better experience for their customers. Through the Citi Bike app, they are able to gather loads of useful data which, when analyzed, reveals great insights into things like user demographics and behavior—for example, when and where people pick up and drop off their bikes and how long the average journey lasts.
Such data is extremely valuable as it helps the good people at Citi Bike to understand how the service is being used, and to plan and make decisions accordingly. For example, at what rate is the customer base growing and how many more bikes should they install across the city to accommodate this growth? Where should they install the most bikes? Who should they tailor their marketing and advertising to? Essentially, data helps them to determine where and how their money and efforts can be invested for maximum impact.
So, throughout this course, your mission is to analyze data collected by Citi Bike (for the purposes of this short course, we will call them NY Citi Bike to make things consistent) and help key stakeholders to make smart, data-driven decisions based on the insights you uncover. Here’s what you’ll seek to investigate:
- What are the most popular pick-up locations across the city for NY Citi Bike rental?
- How does the average trip duration vary across different age groups?
- Which age group rents the most bikes?
- How does bike rental vary across the two user groups (one-time users vs long-term subscribers) on different days of the week?
- Does user age impact the average bike trip duration?
Each tutorial in this course will see you finding answers to these questions and, eventually, turning them into a meaningful story. You’ll start with a raw dataset and end up with professional visualizations and clear, actionable insights to present to key stakeholders 🤩 Exciting times ahead!
For today’s task, you’re going to access the dataset you’ll be working with throughout the course. We’ve shared a view-only file, so you’ll need to make your own copy to work on. To do so:
-
Make sure you’re logged into your Google account, and then access our view-only dataset. We’ve called this version of the dataset “New York Citi Bikes_Raw Data.”
* Note: We cannot give editing permissions as this would edit the sheet for all users- you will need to create a copy, please see below. *
Google sheets is not responsive at this time on mobile devices, we highly recommend using a computer for the duration of this course. -
Click “File” then select “Make a copy” from the drop-down menu:
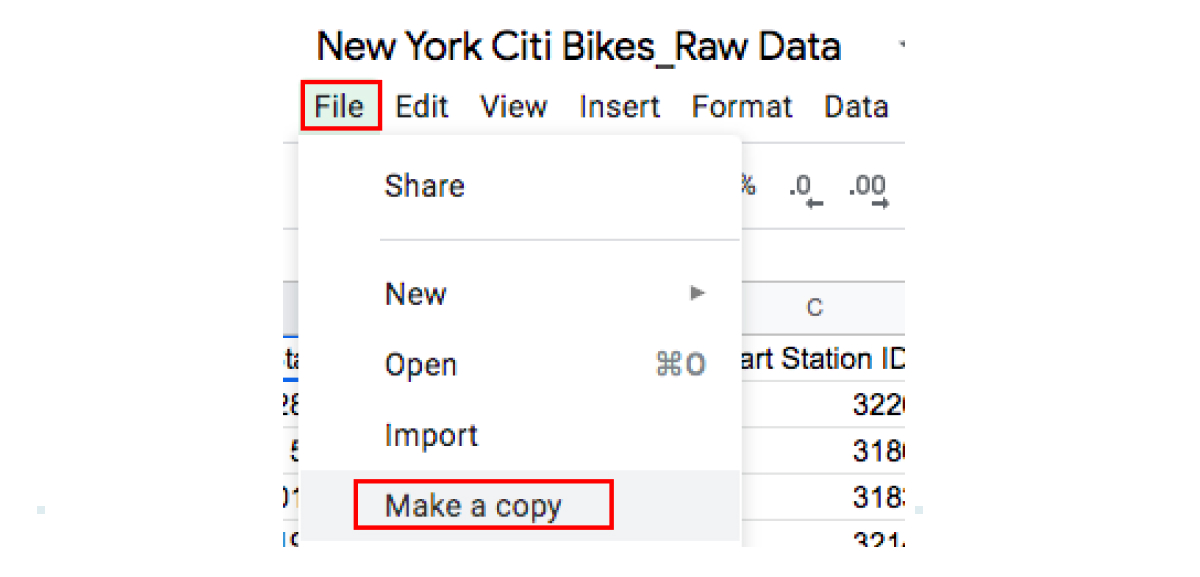
Figure 2.
3. Rename your copy as you like, for example, by adding your name and an underscore before the existing title: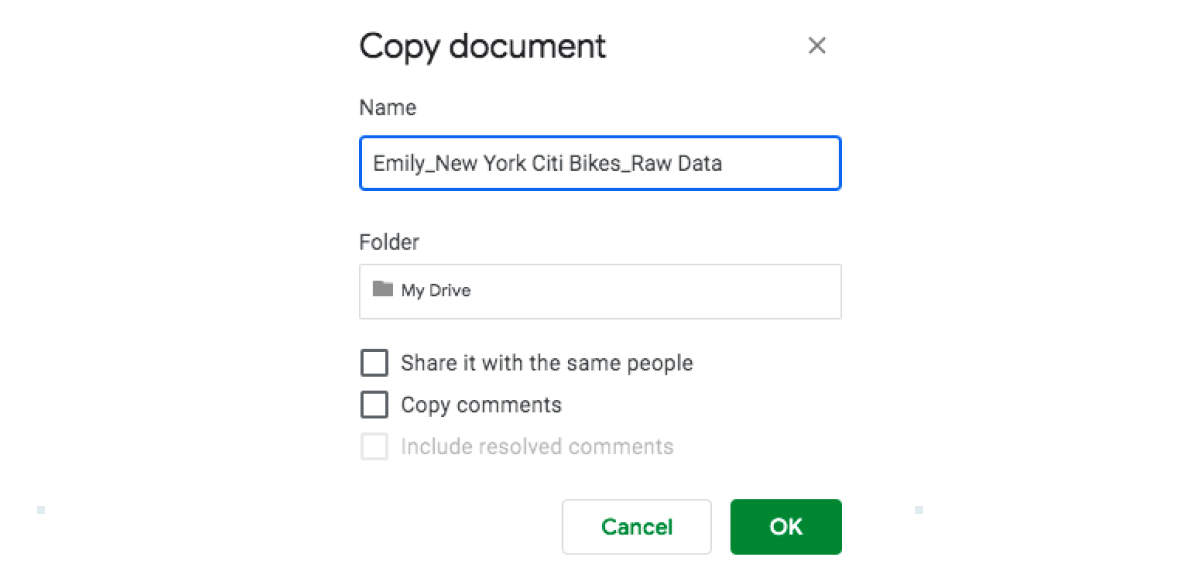
Figure 3.
4. Click “Ok.” That’s it! You’ve now got your own Google Sheets file to work with throughout the course. Copy the link into your “Notes” app or into a Google Doc for easy access.
That’s all you need to do for now—we won’t start working with the data until the next tutorial.
Note: Citi Bike is a real company, and you’ll be working with real data. However, the project is purely hypothetical, created by us for the purpose of this short course 😊 We’ve sourced the data from a free data site: Kaggle.com, and customized it to fit the scope of our project, adding in extra variables as well as excluding other variables. Please ONLY use the data in the link below, or other links provided for the short course and do not download the data from the Kaggle.com site. Thanks!
6. Key takeaways and further reading
That marks the end of your first data analytics tutorial! We focused on setting the scene, exploring what data analytics is and what you might expect from a career in the field.
We’ve also introduced the project you’ll be working on, set out the key questions we’ll seek to answer throughout the course, and opened our Citi Bike dataset. For the rest of the course, we’ll delve into the data analysis process itself, getting hands-on with data and unlocking those valuable insights 🔑
In the next tutorial, we’ll introduce a crucial step in the data analysis process: Data cleaning. We’ll show you how to clean your dataset and prep it for analysis, so be sure to come wearing your data analyst hat 🎩
Keen to learn more? Continue your exploration of data analytics with these articles:
- What is the typical data analyst career path?
- What are some real-world examples of big data?
- Data bootcamp vs. a degree: Which is right for you?
See you soon! 👋