
For anyone working with data, it’s essential to get to grips with certain statistical concepts. This includes understanding the difference between covariance vs correlation—a topic we’ll explain in this beginner-friendly guide.
In today’s big data world, we deal with a wide range of variables to perform various data analytics operations. Finding relationships between variables helps us to deduce meaningful insights that can help organizations make better-informed decisions.
For instance, is there a relationship between tax rates and economic growth of a state? How can you explain this? Scrutinizing the relationship between variables can be quantified by employing statistical analysis tools such as covariance and correlation.
In this post, we’ll discover the key differences between covariance and correlation. Before diving into the details, we will first get a basic understanding of what covariance and correlation mean.
If you’d like to learn more data analytics skills, try this free data short course.
We’ll cover:
- What is covariance?
- What is correlation?
- Covariance vs correlation: What is the difference?
- How do covariance and correlation apply to data analytics?
- Key takeaways and further reading
Are you ready to learn about some of the most common (and most useful!) methods of statistical analysis? Let’s go.
1. What is covariance?
Covariance is a quantitative measure of the degree to which the deviation of one variable (X) from its mean is related to the deviation of another variable (Y) from its mean.
To simplify, covariance measures the joint variability of two random variables. For example, if greater values of one variable tend to correspond with greater values of another variable, this suggests positive covariance. We’ll explore the different types of covariance shortly. First, let’s look at how covariance is calculated in mathematical terms.
Covariance formula
The covariance formula calculates data points from their average value in a dataset. For example, the covariance between two random variables X and Y can be computed using the following formula:

Where:
- xi represents the values of the X-variable
- yi represents the values of the Y-variable
- x represents the mean (average) of the X-variable
- y represents the mean (average) of the Y-variable
- n represents the number of data points
What are the different types of covariance?
Covariance can have both positive and negative values. Depending on the diverse values, there are two main types: Positive and negative covariance.
Positive covariance
Positive covariance means both the variables (X, Y) move in the same direction (i.e. show similar behavior). So, if greater values of one variable (X) seem to correspond with greater values of another variable (Y), then the variables are considered to have positive covariance.
This tells you something about the linear relationship between the two variables. So, for example, if an increase in a person’s height corresponds with an increase in a person’s weight, there is positive covariance between the two.
Negative covariance
Negative covariance means both the variables (X, Y) move in the opposite direction.
As opposed to positive covariance, if the greater values of one variable (X) correspond to lesser values of another variable (Y) and vice-versa, then the variables are considered to have negative covariance.
This figure depicts how the covariance of X and Y might look in the case of positive covariance, negative covariance, and weak covariance:

Case 1 where (x,y) > 0: If (x,y) is greater than zero (i.e. If X is, on average, greater than its mean when Y is greater than its mean and, similarly, if X is, on average, less than its mean when Y is less than its mean), then the covariance for both variables is positive, moving in the same direction.
Case 2 where (x,y) < 0 : If (x,y) is less than zero (i.e. when X is, on average, less than its mean when Y is greater than its mean and vice versa), then the covariance for both variables is negative, moving in the opposite direction.
Case 3 where (x,y) = 0: If (x,y) is zero, then there is no relationship between the two variables.
What is a covariance matrix?
For multi-dimensional data, there applies a generalization of covariance in terms of a covariance matrix. The covariance matrix is also known as the variance-covariance matrix, as the diagonal values of the covariance matrix show variances and the other values are the covariances. The covariance matrix is a square matrix which can be written as follows:

In case of data points having zero mean, then the covariance matrix can be calculated by employing a semi-definite matrix, i.e. XXT as follows:

In simple terms, the covariance matrix for two-dimensional data can be represented as follows:

Here:
- C represents covariance matrix
- (x,x) and (y,y) represent variances of variable X and Y
- (x,y) and (y,x) represent covariance of X and Y
The covariances of both variables X and Y are commutative in nature. In math, commutative simply means that the values can be moved around in the formula and the answer will still be the same, so (x,y) = (y,x). Thus, the covariance matrix is symmetric.
What is the covariance matrix used for?
The most common use cases of the covariance matrix are listed as follows:
- Mahalanobis distance: Mahalanobis distance is calculated by taking the inverse of the covariance matrix.
- Kalman filters: Kalman filters, or Kalman filtering, is an algorithm that provides estimates of certain unknown variables based on measurements observed over time. The weighted average calculated using the covariance matrix helps in predicting the new state of the system that exists in between the predicted and measured state.
- Gaussian mixture models: The covariance matrix can be used to interpret the shape of a multivariate normal cluster, involved in Gaussian mixture models.
- PCA (principal component analysis): PCA (principal component analysis) employs the covariance matrix in order to apply transformations for shrinking the dataset into a set of orthogonal features. You’ll find an in-depth explanation of principal component analysis here.
Now we know what covariance is and what it might be used for, let’s move on to correlation.
2. What is correlation?
So far, we’ve established that covariance indicates the extent to which two random variables increase or decrease in tandem with each other.
Correlation tells us both the strength and the direction of this relationship. Correlation is best used for multiple variables that express a linear relationship with one another. W
hen we assume a correlation between two variables, we are essentially deducing that a change in one variable impacts a change in another variable. Correlation helps us to determine whether or not, and how strongly, changes in various variables relate to each other.
Types of correlation
Correlation is classified into the following types based on diverse values: Positive correlation, negative correlation, and no correlation. Let’s explore those now.
Positive correlation
Two variables are considered to have a positive correlation if they are directly proportional. That is, if the value of one variable increases, then the value of the other variable will also increase.
A perfect positive correlation holds a value of “1”. On a graph, positive correlation appears as follows:

Negative correlation
A perfect negative correlation holds a value of “-1” which means that, as the value of one variable increases, the value of the second variable decreases (and vice versa). In graph form, this is how negative correlation might look:

Zero or no correlation
The value “0” denotes that there is no correlation. It indicates that there is no relationship between the two variables, so an increase or decrease in one variable is unrelated to an increase or decrease in the other variable.
A graph showing zero correlation will follow a random distribution of data points, as opposed to a clear line:

This table perfectly displays the varying degree of correlation between two values.

What is the correlation coefficient?
Correlation is calculated using a method known as “Pearson’s Product-Moment Correlation” or simply “Correlation Coefficient.” Correlation is usually denoted by italic letter r. The following formula is normally used to find r for two variables X and Y.

Where:
- r represents the correlation coefficient
- xi represents the value of variable X in data sample
- x represents the mean (average) of values of X variable
- yi represents the value of variable Y in data sample
- y represents the mean (average) of Y variable
Alternative methods to calculate the correlation coefficient
Besides Pearson’s Product-Moment Correlation, some alternative techniques that are helpful in calculating correlation coefficient include:
What is a correlation matrix?
We use correlation coefficients to determine the relationship between two variables, for example, to find the number of hours a student must spend working to complete a project within the desired timeline. But what if we want to evaluate the correlation among multiple pairs of variables? Then we use a correlation matrix.
A correlation matrix is essentially a table depicting the correlation coefficients for various variables. The rows and columns contain the value of the variables, and each cell shows the correlation coefficient.
Example:
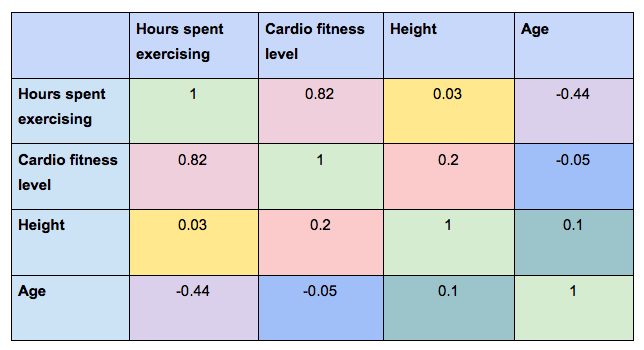
In the following correlation matrix, we can see the correlation coefficient for each possible combination of variables. In this example, we’re looking at:
- Hours spent exercising (per week)
- Cardio fitness level
- Height
- Age
If you consider the two variables “Hours spent exercising” and “cardio fitness level,” you’ll see that the correlation coefficient is 0.82.
This indicates a strong positive correlation between the two variables—which makes sense, right? The more you exercise, the more you’d expect your cardio fitness to increase.
At the same time, the correlation coefficient when comparing “Hours spent exercising” to “Height” is 0.03, indicating that there’s no association between how tall someone is and how often they exercise.
What is the correlation matrix used for?
Practically, the correlation matrix is used to analyze different data-driven problems. A few common use cases include:
- To conveniently encapsulate datasets: For large datasets containing thousands of rows, the correlation matrix is an effective way of summarizing the correlation among various variables of that dataset. The relationship between two variables can easily be interpreted by looking at raw data in the matrix.
- To perform regression testing: Multiple linear regression is difficult to interpret when two independent variables in the dataset are highly correlated. Two variables which are highly correlated can easily be located using a correlation matrix, as its convenient structure helps with quick and easy detection.
- Input for various analyses: Analysis methods such as structural equation models can use the correlation matrix as an input for their calculation process.
3. Covariance vs correlation: What is the difference?
Now we know what covariance and correlation are, let’s consider the difference between the two.
As described previously, covariance illustrates the degree to which two variables vary with respect to each other, while correlation determines the strength and direction of this relationship.
Covariance and correlation are interlinked with each other. In simple terms, correlation refers to the scaled version of covariance. This means that correlation is a special case of covariance which can be achieved when the data is in standardized form.
The key differences between covariance and correlation can be summarized as follows:
What do they measure?
Covariance measures whether a variation in one variable results in a variation in another variable; for example, looking at whether an increase in one variable results in an increase, decrease, or no change in the other variable. Correlation measures the direction as well as the strength of the relationship between two variables (i.e. how strongly these two variables are related to each other).
1. Relationship constraints:
Covariance deals with the linear relationship of only two variables in the dataset, whereas correlation can involve two or multiple variables or data sets and their linear relationships.
2. Value range
Although both correlation coefficient and covariance are measures of linear association, correlation coefficients are standardized, therefore displaying an absolute value within a definite range from -1 to 1. On the other hand, covariance values are not standardized and use an indefinite range from -∞ to +∞ , which makes the interpretation of covariance a bit tricky.
3. Measurement units
Correlation is dimensionless, i.e. it is a unit-free measure of the relationship between variables. In contrast, covariance is in units, which is formed by multiplying the unit of one variable by the unit of another variable.
4. Change in scale
Covariance is affected by the change in scale, i.e. if all the values of one variable are multiplied by a constant and all the values of another variable are multiplied by a similar or different constant, then the covariance is changed. Conversely, correlation is not affected by the change in scale.
4. How are covariance and correlation relevant to data analytics?
Statistics forms the foundation of many data analysis methods and techniques. Some common use cases of covariance and correlation within the field of data analytics include:
- Comparing samples from two or more different populations. This is useful because it helps in analyzing common trends and patterns in different samples.
- In data-driven industries, covariance and correlation help in identifying multivariate data in order to process data and effectively perform analytical operations.
- Correlation is a key method for investigating relations between two variables before implementing statistical modeling.
- PCA (principal component analysis) is implemented using covariance and correlation in order to shrink dimensions of large datasets to enhance interpretability. Data scientists use PCA to carry out predictive analysis and exploratory data analysis.
- Analytical processes such as multivariate analysis and feature selection are accomplished by employing covariance and correlation methods.
5. Key takeaways and further reading
In this post, we’ve discussed two key concepts: covariance and correlation. We explored different relationship types, the covariance matrix, the correlation matrix, their common features and use cases, as well as potential differences between the two. Here are the key takeaways.
- Covariance and correlation are two statistical tools that are closely related but different in nature. Both techniques interpret the relationship between random variables and determine the type of dependence between them.
- Covariance is a measure of correlation, while correlation is a scaled version of covariance. This means correlation is a special case of covariance which can be achieved when the data is in standardized form.
- Covariance tells us the direction of the relationship between two variables, while correlation provides an indication as to how strong the relationship between the two variables is, in addition to the direction of correlated variables.
- Correlation values range from +1 to -1. On the other hand, covariance values can exceed this scale, ranging from +-∞ to +∞.
- Both correlation and covariance can be positive or negative, depending on the values of the variables.
- A positive covariance always leads to a positive correlation, and a negative covariance always outputs a negative correlation. This is due to the fact that correlation coefficient is a function of covariance.
Statistical concepts form the foundation of many data analytics and data science techniques. To try your hand at some simple data analysis with a real dataset, give CareerFoundry’s free five-day data short course a go.
And, for more useful guides, check out the following: