Imagine being able to answer any data question within a matter of minutes. Imagine not having to download and import data into spreadsheets before you even begin to analyze your dataset. Imagine typing SQL queries off the top of your head.
I’m speaking from experience when I tell you that this is completely possible. Sometimes, though, it’s difficult to know where to start. I’ve written this post to solve that problem for you.
I want this post to be the first step in your journey to becoming a data-savvy professional, equipping you with skills which are guaranteed to elevate your career and your business. In the next 15-30 minutes you’ll write some really useful queries and learn the foundations of data analysis with SQL.
But before we dive into it, let me briefly introduce myself. My name’s Anatoli, and, by night, I’m the founder and author of SQL Habit—an online course which teaches SQL via business simulation, complete with real life product and marketing data. By day, you can find me working as the Lead Engineer/Data Analyst in the Growth Department at Blinkist, the number one book summary app in the world, with 16 million users.
Ready to start learning SQL? Here’s what we’ll cover:
- Setting the scene: Why use SQL?
- Glossary of SQL terms
- Getting started: Setting up your SQL editor
- How to write queries in SQL
- Foundation: SELECT and FROM commands
- Sorting records with ORDER BY command
- Show specific number of records with LIMIT command
- Your first SQL function: COUNT()
- AVG() function
- Using aliases with AS command
- Building your first report with GROUP BY command
- Next steps
1. Why use SQL?
My advice to anyone who’s starting out with SQL is simple: Use it! Whether at work or on one of your own personal projects, it’s important to try to answer some real questions. It’s just like learning any language—the earlier you start using it, the sooner you’ll be able to use it fluently.
This is how I learned SQL. I work in a tech startup with a mobile app which is used by more than 15 million people worldwide. From our data, I can easily and quickly answer questions like:
- How many new users signed up lately?
- How effective are our marketing campaigns?
- What are the most useful features of our app?
- Where do we lose users?
- And I can slice the above data by month, per country, by marketing campaign, pretty much anything!
So, in summary, you can answer any question (!!) by simply typing an SQL query. Sounds like a super power, right?
Before we get to our first query, let’s learn the basic vocabulary of SQL.
2. Glossary of SQL terms
Database
An SQL database is a physical server where you data is stored. It could be hosted on your computer or on a remote server.
Tables and columns
An SQL database consists of tables. Tables have names like users or purchases. Similar to spreadsheets, they have multiple rows and columns. Each column has a predefined type (you define it when creating a table) like number, date, or text.
Query
Any data analysis is a dialogue between you and the database. You ask questions in the form of SQL queries that are sent to the SQL database server. For example, here’s a query that counts all users:
{% highlight sql linenos %}
SELECT COUNT(*)
FROM users
{% endhighlight %}
SQL client
To connect to an SQL database you need an SQL client. It usually looks like a text editor where you simply type queries.
Result set
Result set is the data returned by your query.
Result set is a table that was generated by the SQL server using your query. Even when a result set is a single number, it’s still a table with one column and one row.
3. Start working with real data
In a minute, you’ll write your first query. Let’s make sure you have an SQL editor at hand. Feel free to skim further, but I highly recommend you actually type the following queries to get the maximum value from this tutorial.
Option 1 (the simplest). Sign up for SQL Habit (it’s free) and go to the Playground—it’s a fully functional SQL client working in your browser, no setup needed.
Option 2. Ask a System Administrator at work to give you a read-only access to your company’s database (or say “data warehouse” to get extra points). I’m pretty sure you’ll get a recommendation for choosing an SQL client as well (it’s likely that your company already has a license for a great client).
4. How to write queries in SQL
You’re all set up. Let’s start writing SQL queries!
Dataset
In this tutorial you’ll be working with a single table that contains user data for a mobile app. If you’re using SQL Habit’s client, the table you need is called users.
To do any type of data analysis, it’s really important to understand how the data made it to this table. In our case, think about this scenario: every time a user signs up within a mobile app, a new record is created in the users table.
Here’s a data sample of the users table:

As you can see, an SQL table is very similar to a spreadsheet: it has rows and columns (note that each column has a unique name) and, just by looking at a table, you can infer the column types: id columns is clearly a number and email is a text one.
5. Foundation: SELECT and FROM commands
The whole challenge of working with SQL is to translate our business question into an SQL query.
The most basic question we can ask our dataset is “What data do we have?” That may sound simple, but don’t be misled—there’s a ton of things you can learn from this question.
This question translates into the following query:
{% highlight sql linenos %}
SELECT *
FROM users
{% endhighlight %}
You used 4 commands or keywords here: SELECT, *, FROM and users.
FROM tells our SQL server which table you’re going to use. FROM users can be interpreted as “We’ll be working with the users table”. SELECT command tells an SQL server which columns you want to have in your result set. The * is a wildcard for “all columns”. Alternatively, we can select specific columns:
{% highlight sql linenos %}
SELECT email, country
FROM users
{% endhighlight %}
Let’s do a quick recap. Our initial request of Show me all the data (or, more accurately; Show me all the data in the table) in SQL is essentially; Select all columns from a specific table:
{% highlight sql linenos %}
SELECT *
FROM users
{% endhighlight %}
These are the basic components of every single query you’ll write in the future: SELECT and FROM.
It might seem like this query is so simple and basic that we can’t really get any value out of it, but that’s not true at all. Of course, more complex questions require more SQL knowledge, but you’ll soon see that there’s a finite number of patterns required to perform any type of data analysis.
SELECT * FROM is a pattern I always use in my analysis. I start any analysis by running this query just to get a glimpse of the data I’ll be working with. You can see what columns are in the table, what data types there are, and whether some columns always have data or not. You can see patterns in data—is there a limited amount of values or are all values unique? You can get all these answers by running this simple query and observing the output. Now you’ve added your first query to your data toolbox, let’s move onto the next one.
6. Sorting records with ORDER BY command
You may have noticed that the result set of our very first query is ordered in a strange way. Let’s level up our previous request to the following: Show me the most recent users data.
When analyzing your data set, you’ll often want to order it by the time of creation or modification. Why? Well, the way data is stored and processed could change over time (you add new data like more signup platforms, new columns, etc) and it’s important to see the latest state.
To order data in the result set, we need to use the ORDER BY statement:
{% highlight sql linenos %}
SELECT *
FROM users
ORDER BY signup_date DESC
SELECT *
FROM users
ORDER BY signup_date ASC
{% endhighlight %}
You need to specify a column that’ll be used for sorting, and the direction: DESC (descending, Z to A) or ASC (ascending, A to Z).
7. Show specific number of records with LIMIT command
When you run SELECT * FROM querythe SQL server will send you all the data in a table. This can sometimes be problematic. Imagine your app has 1+ million users—it might take a while and could cause unnecessary load to the database server to output all data for every single user.To avoid this, you simply need to limit the size of a result set. In plain English, our request to the database will be; Show me the data of 100 most recent users.
In the end, we’re running our SELECT * FROM queries to inspect the data visually—we don’t need millions of rows, right?
The LIMIT keyword in a query always comes last. You just need to specify how many rows will be in the result set:
{% highlight sql linenos %}
SELECT *
FROM users
ORDER BY signup_date DESC
LIMIT 100
{% endhighlight %}
8. Your first SQL function: COUNT
Look at you! You already know the fundamentals of how to inspect any table in your company’s database! As I mentioned, I always start any data analysis by simply inspecting the latest data in tables I’ll be working with, using exactly those commands we’ve just learned.
Now it’s time to move onto some slightly harder, slightly more practical questions. For example, let’s ask; “How many users have signed up for our product so far?”
Such a question, when translated into SQL-speak, will read; How many rows are there in the users table?
So far we’ve been printing table data as it is. Now we want something very different: we want to do some calculations based on the table’s data. Specifically, we want to count its records.
Such calculations exist in SQL as functions. You may think about them as functions from mathematics—they take arguments and return values. But don’t be put off by this terminology. The concepts behind it are straightforward.
The function we’ll need for our problem is COUNT(*). It’s an example of an aggregate function in SQL because it “aggregates” data. Instead of printing all records, it counts (aggregates) them and tells you how many rows match your query’s criteria. In our users table, we have one row per user. Therefore, if we count how many rows we have in the table, we’ll know exactly how many users our product has. Simple. Magic!
{% highlight sql linenos %}
SELECT COUNT(*)
FROM users
{% endhighlight %}
9. AVG function
Let’s take a look at another aggregate function that calculates an average value in a column: AVG().
{% highlight sql linenos %}
SELECT AVG(age)
FROM users
{% endhighlight %}
This query calculates an average of all our users—in this case, the average age.
You’ll rarely need just one number from your data research. Most of the time you’ll need to report multiple numbers, such as the average age and the user count. Since both these numbers rely on the same table, we can combine them in one query:
{% highlight sql linenos %}
SELECT
COUNT(*) AS users_count,
AVG(age) AS avg_age
FROM users
{% endhighlight %}
10. Using aliases with AS command
You may have noticed a new SQL command in the previous query—AS. AS allows you to name the columns of the result set. The thing is when you use functions in a query, SQL will name new columns in the result set as these functions (like count or avg).
To keep things organized, I highly recommend that you always use aliases (AS) for new columns. Column names serve as living documentation for your query and will be useful for you (or your colleagues) in the future.
11. Building your first report with GROUP BY command
I want to leave you with one more SQL command that will bring you one step closer to performing real data analyses. I’m talking about GROUP BY, an SQL command that allows you to calculate aggregate values (using aggregate functions like COUNT or AVG) on segments of data.
For example; “What is the average age of our users in the USA?” or “Which is the country with the highest number of users?”. These questions sound like the real deal, right?
Well, that’s because they are. GROUP BY is the main instrument of Data Analysis. To get the signal from the noise, you’ll constantly need to use different dimensions (country, age group, week/month/year of signup, AB-test variation).
Here’s an example of data analysis based on GROUP BY: One morning you find out that the overall signup rate for your product has dropped by 20%. It’s really hard to take any action based on this fact, because there are no specifics. You’ll proceed with calculating signup rates per country, per marketing campaign, per page, etc. to locate the problem. Perhaps, for example, the signup rate dropped to zero on one specific page due to a technical error, but it looked like a 20% drop overall.
Moving on to the SQL syntax, GROUP BY requires you to select a column you’ll use for aggregation, such as country:
{% highlight sql linenos %}
SELECT
country,
COUNT(*)
FROM users
GROUP BY country
{% endhighlight %}
Note that the country column is specified after GROUP BY and in the SELECT statement. That way, a result set will have all unique values of the country column and their aggregates (number of users in each country or, in SQL, the number of rows in the users table with the same value of country).
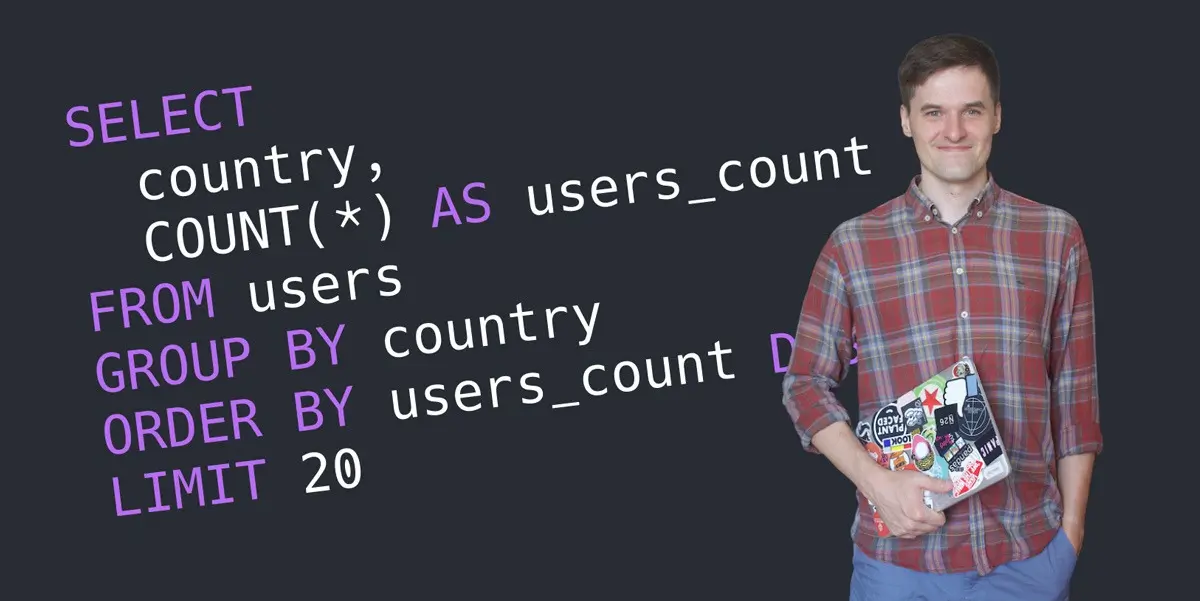
Let’s use everything we’ve learned so far to produce a final report:
{% highlight sql linenos %}
SELECT
country,
COUNT(*) AS users_count
FROM users
GROUP BY country
ORDER BY users_count DESC
LIMIT 20
{% endhighlight %}
The result set of this query contains the TOP 20 countries by the number of signups. And yes, that’s your very first analytics report! Congratulations!
12. Next steps
Of course, data analysis with SQL is much, much bigger (and even more fascinating!) than described in this article. I hope it gave you a jump start into the world of learning SQL, and that you see how much there is to gain for your career or business.
Here are some of the major next steps in learning SQL:
- Filtering (show example for each query)
- SQL joins
- Window functions
- Scalar functions
- Learning marketing/product metrics
- Report types (histograms, timelines, etc)
And of course, I highly recommend that you sign up for CareerFoundry’s free introductory data analytics short course. Or, if you want to focus on SQL, check out these SQL certifications, or join me at SQL Habit.
Want to learn more handy data tools and techniques? Check out the following: