Data Analytics Program Curriculum
A learning experience that’s as rigorous and in sync with the industry as it is suited to beginners and upskillers alike.
Skills-focused
Every aspect of our curriculum is specifically designed to help you cultivate the industry’s most in-demand skills. From statistical analysis and testing to data visualization, predictive analysis—and everything in between—you’ll graduate with everything you need to thrive in your new career.
Rigorously practical
Our project-based curriculum takes you well beyond theory to immerse you in the kind of work you’ll be doing on the job. You’ll put everything you learn to immediate, practical use through hands-on projects—all integral to the professional portfolio you’ll build along the way.
Written by experts
Our instructional designers and editors work together with seasoned and skilled subject matter experts to create and continuously update learning materials that equip you with the industry knowledge and skills that will get you hired.
Curriculum overview
1 month
7 months
2 months
0.5 months - 1 month
3.5 - 7 months
1 - 2 months
0.5 months
3.5 months
1 month
Completion times are approximations based on the progress of our current students and graduates
This course will take you through ten tasks leading up to one main project: a descriptive analysis of a video game data set to inform product development and sale strategies.

1.1 Data Analytics in Practice
Learn what data analysts do and get ready to kick off your own analysis.
1.2 Introduction to Excel
Get to know Excel and learn how to sort, filter, format, organize, and visualize data.
1.3 Understanding Your Data Set
Analyze and describe your data set, then identify sources of bias.
1.4 Cleaning Your Data
Identify errors in your data and learn how to clean your data and minimize issues.
1.5 Grouping & Summarizing Your Data
Create and manipulate pivot tables and learn more advanced Excel skills.
1.6 Introduction to Analytical Methods
Explore different approaches to data analytics and the role of statistics.
1.7 Conducting a Descriptive Analysis
Conduct a descriptive analysis by applying statistical methods in Excel.
1.8 Developing Insights
Learn how to form hypotheses about data sets, and to generate useful insights.
1.9 Visualizing Data Insights
Build helpful visualizations of your data to present findings to stakeholders.
1.10 Storytelling with Data
Learn to present the results of your analysis in compelling ways.
Immerse yourself into the mindset, processes, and tools that data professionals use every day. You’ll complete a total of six projects (achievements) consisting of several tasks each.

Achievement 1
Achievement 2
Achievement 3
Achievement 4
Achievement 5
Achievement 6
Preparing & Analyzing Data
Learn how to interpret business requirements to guide your data analysis and begin developing and designing your data project. Here’s what you’ll learn:
A Brief History of Data Analytics
Starting with Requirements
Designing a Data Research Project
Sourcing the Right Data
Data Profiling & Integrity
Data Quality Measures
Data Transformation & Integration
Conducting Statistical Analyses
Statistical Hypothesis Testing
Consolidating Analytical Insights
Data Visualization & Storytelling
Explore the different types of data visualization and what they can be used for, as well as some best practices to keep your visualizations accessible and easily interpretable.
Intro to Data Visualization
Visual Design Basics & Tableau
Comparison & Composition Charts
Temporal Visualizations & Forecasting
Statistical Visualizations: Histograms & Box Plots
Statistical Visualizations: Scatterplots & Bubble Charts
Spatial Analysis
Textual Analysis
Storytelling with Data Presentations
Presenting Findings to Stakeholders
Databases & SQL for Analysts
Develop database-querying skills while mastering SQL, the industry-standard language for performing these tasks in the real world.
Intro to Relational Databases
Data Storage & Structure
SQL for Data Analysts
Database Querying in SQL
Filtering Data
Summarizing & Cleaning Data in SQL
Joining Tables of Data
Performing Subqueries
Common Table Expressions
Presenting SQL Results
Python Fundamentals for Data Analysts
Get hands-on with Python—the go-to language used by data analysts to conduct advanced analyses. Here’s what you’ll learn:
Introduction to Programming for Data Analysts
Jupyter Fundamentals & Python Data Types
Introduction to Pandas
Data Wrangling & Subsetting
Data Consistency Checks
Combining & Exporting Data
Deriving New Variables
Grouping Data & Aggregating Variables
Intro to Data Visualization with Python
Coding Etiquette & Excel Reporting
Data Ethics & Applied Analytics
Learn how to identify and address data bias, data privacy, and data security. You’ll also explore big data analysis, machine learning, and data mining.
Intro to Big Data
Data Ethics: Data Bias
Data Ethics: Security & Privacy
Intro to Data Mining
Intro to Predictive Analysis
Time Series Analysis & Forecasting
Using GitHub as an Analyst
Preparing a Data Analytics Portfolio
Advanced Analytics & Dashboard Design
Complete an analysis project using data of your choosing, and build on your advanced analytics skills by taking a dive into machine learning and regression analysis.
Sourcing Open Data
Exploring Relationships
Geographical Visualizations with Python
Supervised Machine Learning: Regression
Unsupervised Machine Learning: Clustering
Sourcing & Analyzing Time Series Data
Creating Data Dashboards
To further develop your expertise, you’ll choose one of two specialization course options: Machine Learning with Python or Data Visualizations with Python.

Data Visualizations with Python
Achievement 1
Achievement 2
Machine Learning with Python
Achievement 1
Achievement 2
Network Visualizations and Natural Language Processing with Python
Learn how to create network visualizations and identify the relationships between different elements of data.
Intro to Freelance and Python Tools
Setting Up the Python Workspace
Virtual Environment in Python
Accessing Web Data with Data Scraping
Text Mining
Intro to NLP and Network Analysis
Creating Network Visualizations
Dashboards with Python
Learn about the intricate functionalities and settings of Python’s core visualization libraries.
Tools for Creating Dashboards
Project Planning and Sourcing Web Data with an API
Fundamentals of Visualization Libraries Part 1
Fundamentals of Visualization Libraries Part 2
Advanced Geospatial Plotting
Creating a Python Dashboard
Refining and Presenting a Dashboard
Basics of Machine Learning for Analysts
Dive into ethics, start preparing your data for supervised and unsupervised learning, and look into optimization algorithms.
The History and Tools of Machine Learning
Ethics and Direction of Machine Learning Programs
Optimization in Relation to Problem-Solving
Supervised Learning Algorithms Part 1
Supervised Learning Algorithms Part 2
Presenting Machine Learning Results
Real-World Applications of Machine Learning
Look into more complex machine learning concepts, as well as unsupervised learning, deep learning, and visual data.
Unsupervised Learning Algorithms
Complex Machine Learning Models and Keras Part 1
Complex Machine Learning Models and Keras Part 2
Evaluating Hyperparameters
Visual Applications of Machine Learning
Presenting Your Final Results
Intro to Data Analytics
This course will take you through ten tasks leading up to one main project: a descriptive analysis of a video game data set to inform product development and sale strategies.
1.1 Data Analytics in Practice
1.2 Introduction to Excel
1.3 Understanding Your Data Set
1.4 Cleaning Your Data
1.5 Grouping & Summarizing Your Data
1.6 Introduction to Analytical Methods
1.7 Conducting a Descriptive Analysis
1.8 Developing Insights
1.9 Visualizing Data Insights
1.10 Storytelling with Data
Data Immersion
Immerse yourself into the mindset, processes, and tools that data professionals use every day. You’ll complete a total of six projects (achievements) consisting of several tasks each.
Preparing & Analyzing Data
Learn how to interpret business requirements to guide your data analysis and begin developing and designing your data project. Here’s what you’ll learn:
-
A Brief History of Data Analytics
-
Starting with Requirements
-
Designing a Data Research Project
-
Sourcing the Right Data
-
Data Profiling & Integrity
-
Data Quality Measures
-
Data Transformation & Integration
-
Conducting Statistical Analyses
-
Statistical Hypothesis Testing
-
Consolidating Analytical Insights
Data Visualization & Storytelling
Explore the different types of data visualization and what they can be used for, as well as some best practices to keep your visualizations accessible and easily interpretable.
-
Intro to Data Visualization
-
Visual Design Basics & Tableau
-
Comparison & Composition Charts
-
Temporal Visualizations & Forecasting
-
Statistical Visualizations: Histograms & Box Plots
-
Statistical Visualizations: Scatterplots & Bubble Charts
-
Spatial Analysis
-
Textual Analysis
-
Storytelling with Data Presentations
-
Presenting Findings to Stakeholders
Databases & SQL for Analysts
Develop database-querying skills while mastering SQL, the industry-standard language for performing these tasks in the real world.
-
Intro to Relational Databases
-
Data Storage & Structure
-
SQL for Data Analysts
-
Database Querying in SQL
-
Filtering Data
-
Summarizing & Cleaning Data in SQL
-
Joining Tables of Data
-
Performing Subqueries
-
Common Table Expressions
-
Presenting SQL Results
Python Fundamentals for Data Analysts
Get hands-on with Python—the go-to language used by data analysts to conduct advanced analyses. Here’s what you’ll learn:
-
Introduction to Programming for Data Analysts
-
Jupyter Fundamentals & Python Data Types
-
Introduction to Pandas
-
Data Wrangling & Subsetting
-
Data Consistency Checks
-
Combining & Exporting Data
-
Deriving New Variables
-
Grouping Data & Aggregating Variables
-
Intro to Data Visualization with Python
-
Coding Etiquette & Excel Reporting
Data Ethics & Applied Analytics
Learn how to identify and address data bias, data privacy, and data security. You’ll also explore big data analysis, machine learning, and data mining.
-
Intro to Big Data
-
Data Ethics: Data Bias
-
Data Ethics: Security & Privacy
-
Intro to Data Mining
-
Intro to Predictive Analysis
-
Time Series Analysis & Forecasting
-
Using GitHub as an Analyst
-
Preparing a Data Analytics Portfolio
Advanced Analytics & Dashboard Design
Complete an analysis project using data of your choosing, and build on your advanced analytics skills by taking a dive into machine learning and regression analysis.
-
Sourcing Open Data
-
Exploring Relationships
-
Geographical Visualizations with Python
-
Supervised Machine Learning: Regression
-
Unsupervised Machine Learning: Clustering
-
Sourcing & Analyzing Time Series Data
-
Creating Data Dashboards
Specialization
To further develop your expertise, you’ll choose one of two specialization course options: Machine Learning with Python or Data Visualizations with Python.
Data Visualizations with Python
You’ll process data, and build polished visualizations and dashboards with Python for an academic research organization and a bike-sharing company
Machine Learning with Python
You’ll use machine learning to make long-term predictions about climate change for certain types of populations around the globe.

Built on proven learning theories and industry expertise
Dive into a comprehensive and varied learning experience designed to take you from beginner to Data Analytics pro.
Each course is packed with reading materials, supporting audio learning options, and more.
Our instructional designers work hand-in-hand with seasoned experts in the field to keep the curriculum rooted in proven learning theories, and in-sync with the latest industry practices.
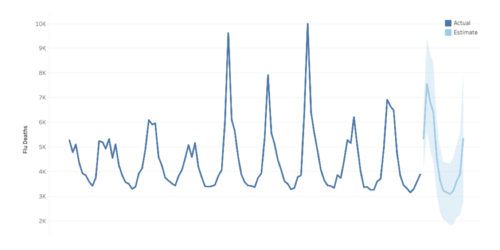
Graduate portfolios
View some of the incredible work our students completed during the Data Analytics Program


Create your portfolio with industry-standard tools
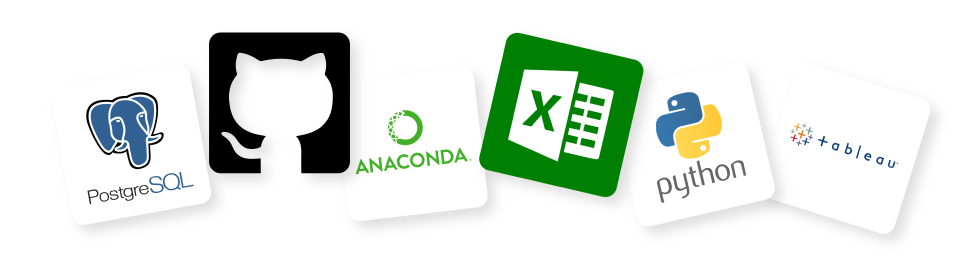
Data Analysis Tools
Where needed, we’ve partnered up with industry-standard tool providers to make sure you have access to the tools you’ll likely use in your new career, although most of the tools you’ll encounter in this program are free to use. The program is continuously benchmarked to ensure you’re learning the tools you’ll be most likely to encounter in your new career.
What our graduates have to say


How would you like us to contact you?
Book a time to speak with a program advisor
Send us a message


What questions do you have about the program? We're happy to help.
Thank you!
Our program advisor will be in touch with you shortly.