Welcome to tutorial four of your Digital Marketing for Beginners Course. In the last step, we looked at the importance of research in devising impactful marketing strategies and campaigns. Now, we're going to turn our attention to how we measure the success of these campaigns.
Let’s look at what we’ll be covering in this tutorial in a little more detail:
- Introduction
- What's a metric and what's a KPI?
- What are secondary metrics?
- Upper funnel metrics
- Mid funnel metrics
- Lower funnel metrics
- Summary
1. Introduction
The primary purpose of digital marketing is to ensure a company is healthy. While many people may associate good marketing with stratospheric growth, this isn't necessarily what "healthy" means.
A mature and nuanced approach to marketing will take into account all sorts of factors.
There are many tactics which you can undertake to maximize short-term growth; you can invest heavily in paid marketing campaigns to drive demand, and you can offer heavy, time-limited discounts to appeal to potential customers' base instincts to react to the manufactured sense of scarcity and urgency.
But what happens in the longer term? Well, you may find that your investments in paid marketing aren't profitable, or that you've offered so many discounts that potential customers will now only buy if you're running an offer, which will also impact your margins.
It's also important to remember that a whole company needs to scale as the number of customers and revenue scales. If you grow your company 50% from one year to the next, you'll need to make sure that your product and operations can handle it ⚖️
If they become overwhelmed, the quality of your service will be impacted, which will lead to long-lasting impacts to the company performance; bad reviews, less word of mouth, competitors who can get a step ahead by offering a better experience.
Good marketing isn't growth at any cost. It's growth at the right cost—it should lift a whole company, rather than simply the amount of cash in the bank account.
A company that indulges in too many short-term growth tactics and scales before its time will sacrifice its integrity—its reputation. It will enter a cycle of overpromising and underdelivering. This act of doing the right thing and taking the time to build a company that's built on a strong foundation is what's necessary to create a durable, impactful, profitable brand. Good digital marketing will find the perfect balance between brand marketing and growth marketing.
As Julian Shapiro says;
"Brand marketing increases the potential energy for revenue: it primes users to convert at a higher rate in the future. Growth marketing then converts that potential energy into kinetic: it increases conversions now."
So how do you know whether you're doing your marketing right?
The answer is metrics ✅
2. What's a metric and what's a KPI?
Digital marketing is a process of data-driven revenue maximization. A marketing team requires a set of data points towards which they drive. These data points are the metrics—measurable values to demonstrate the effectiveness of what they're doing.
These metrics are distributed across a hierarchy based upon their importance and relevance to the company's overall goal of maximizing revenue and the team's ability to operationalize this goal.
Typically, a team will have one KPI, or key performance indicator, which sits at the top of their hierarchy of metrics. This KPI needs to be carefully set, as it defines what the team strives towards and is used as the primary measure to judge how successful they are. The team will track and report on this metric very frequently; at the very least every month, but in a truly data-driven organization, KPIs can be reported on accurately in real-time.
Alongside the KPI, it's good practice to have an efficiency KPI, or efficiency metric. The efficiency metric helps to ensure that the company's health isn't being sacrificed in order to reach the KPI.
Let's break this down with a simple example.
A digital marketing team's KPI is normally one of two things: either the number of sales the company makes, and therefore the projected revenue generated, or some kind of hand-off to a sales team. This hand-off most commonly comes in the form of a meeting booked with a sales representative, or some other kind of commitment from the potential customer, or "lead."
Let's take the example of sales and return to the idea of short-term gains through heavy investment in paid marketing. If we imagine we give a marketing team the objective of selling 500 units at $100 in a month (thus generating $50,000), there's nothing stopping them going out and spending a few million dollars on an advertising campaign to hit this target 🏃
Unfortunately, this would bankrupt the company. Therefore, we need to set an efficiency KPI. We say; we need you to sell 500 units, but the maximum you can spend per unit sold is $20. Therefore your month's marketing budget is $10,000, and we can be confident as a company that we'll continue to operate with healthy margins on our products or services sold.
This approach empowers the marketing team, and immediately offers a lucid understanding of success. Success could be selling the desired number of units at the desired price per unit (commonly referred to as CPA, CPO, or CAC, cost per acquisition, cost per order, or cost per acquired customer respectively), but it could also mean selling the desired number of units at a price lower than $20, thus resulting in even healthier margins, or, even better, selling even more units at a lower price 💪
So now you know about the KPI and efficiency KPI, what about all the other metrics?
3. What are secondary metrics?
The digital marketer needs a whole portfolio of metrics to do their job properly. Yes, their ultimate goal is to deliver on their KPI, but they'll need to have an excellent grasp of their channel's metrics in order to deliver.
These other metrics are often referred to as secondary metrics, and will be accompanied by their own efficiency metrics, sometimes referred to as monitoring or health metrics. If tracked and reported on properly, these secondary metrics will tell the story of the KPI. An experienced digital marketing manager will be able to use these metrics to predict the future trajectory of their KPI.
Let's take another example. This time, let's imagine we're an SEO manager for a financial services company 🏦
What can an SEO manager influence? The amount of traffic that comes to their website through search engines.
Do they have much influence on the actual sale? Yes and no.
Yes, they can produce and optimize content aimed at people near the purchase moment (a product comparison page, for example), but no, they aren't responsible for speaking directly to leads or sending them offers to trigger the purchase moment in the same way that a sales representative, sales operations manager, or CRM manager is able to do.
Therefore, it probably makes sense to incentivize an SEO manager by setting them the KPI of traffic volume through search engines, and the target of incrementally increasing traffic to the website through these search engines.
But what should the efficiency metric be? What happens if your SEO manager goes away and writes the web's definitive biographical content about Taylor Swift. Yes, you might get a lot of traffic, but if you're in the financial services industry, you might not see many conversions!
The efficiency metric needs to be something that ensures relevance. One way of doing this would be to set a target conversion rate for visit-to-lead as the efficiency metric; for every 100 people who visit the site, 5 need to demonstrate interest (and therefore relevance) by signing up for an exploratory call into how our financial services can help them 🪙
So that's the suite of KPIs sorted, but what about the secondary metrics? Well, firstly, the SEO manager can look at much the same metrics of traffic and conversion rate per web page, rather than cumulatively, to identify pages which could be optimized and improved. A
significant improvement in the performance of one of these pages may lead the manager to be able to predict an uplift in the number of calls in a few weeks' time, assuming the conversion rate remains stable 📈
The SEO manager might dive deeper into the performance of individual pages by looking at metrics like bounce rate and session or read time; bounce rate is a measure of how many people leave a page within a given amount of time, or don't read more than one page on your website, while read time is exactly that; how long a visitor remains on your page.
Adjusting the opening paragraph of the text on a page might nudge the bounce rate down and the read time up. This will have two effects. Firstly, search engines will judge the content more positively because they perceive the visitor's need to have been (better) fulfilled, and they will therefore rank the content higher. Secondly, the visitor will spend more time on your site, which increases the probability that they will convert to the next step on the funnel! 😍
Now you've got a comprehensive introduction to how marketing metrics work, let's take a walk down the funnel to get acquainted with the most common metrics. This will not only help you to translate the funnel into real-world metrics, but will also prime you on a ton of digital marketing terminology that you'll need to know.
Ready? Then let us begin.
4. Upper funnel metrics
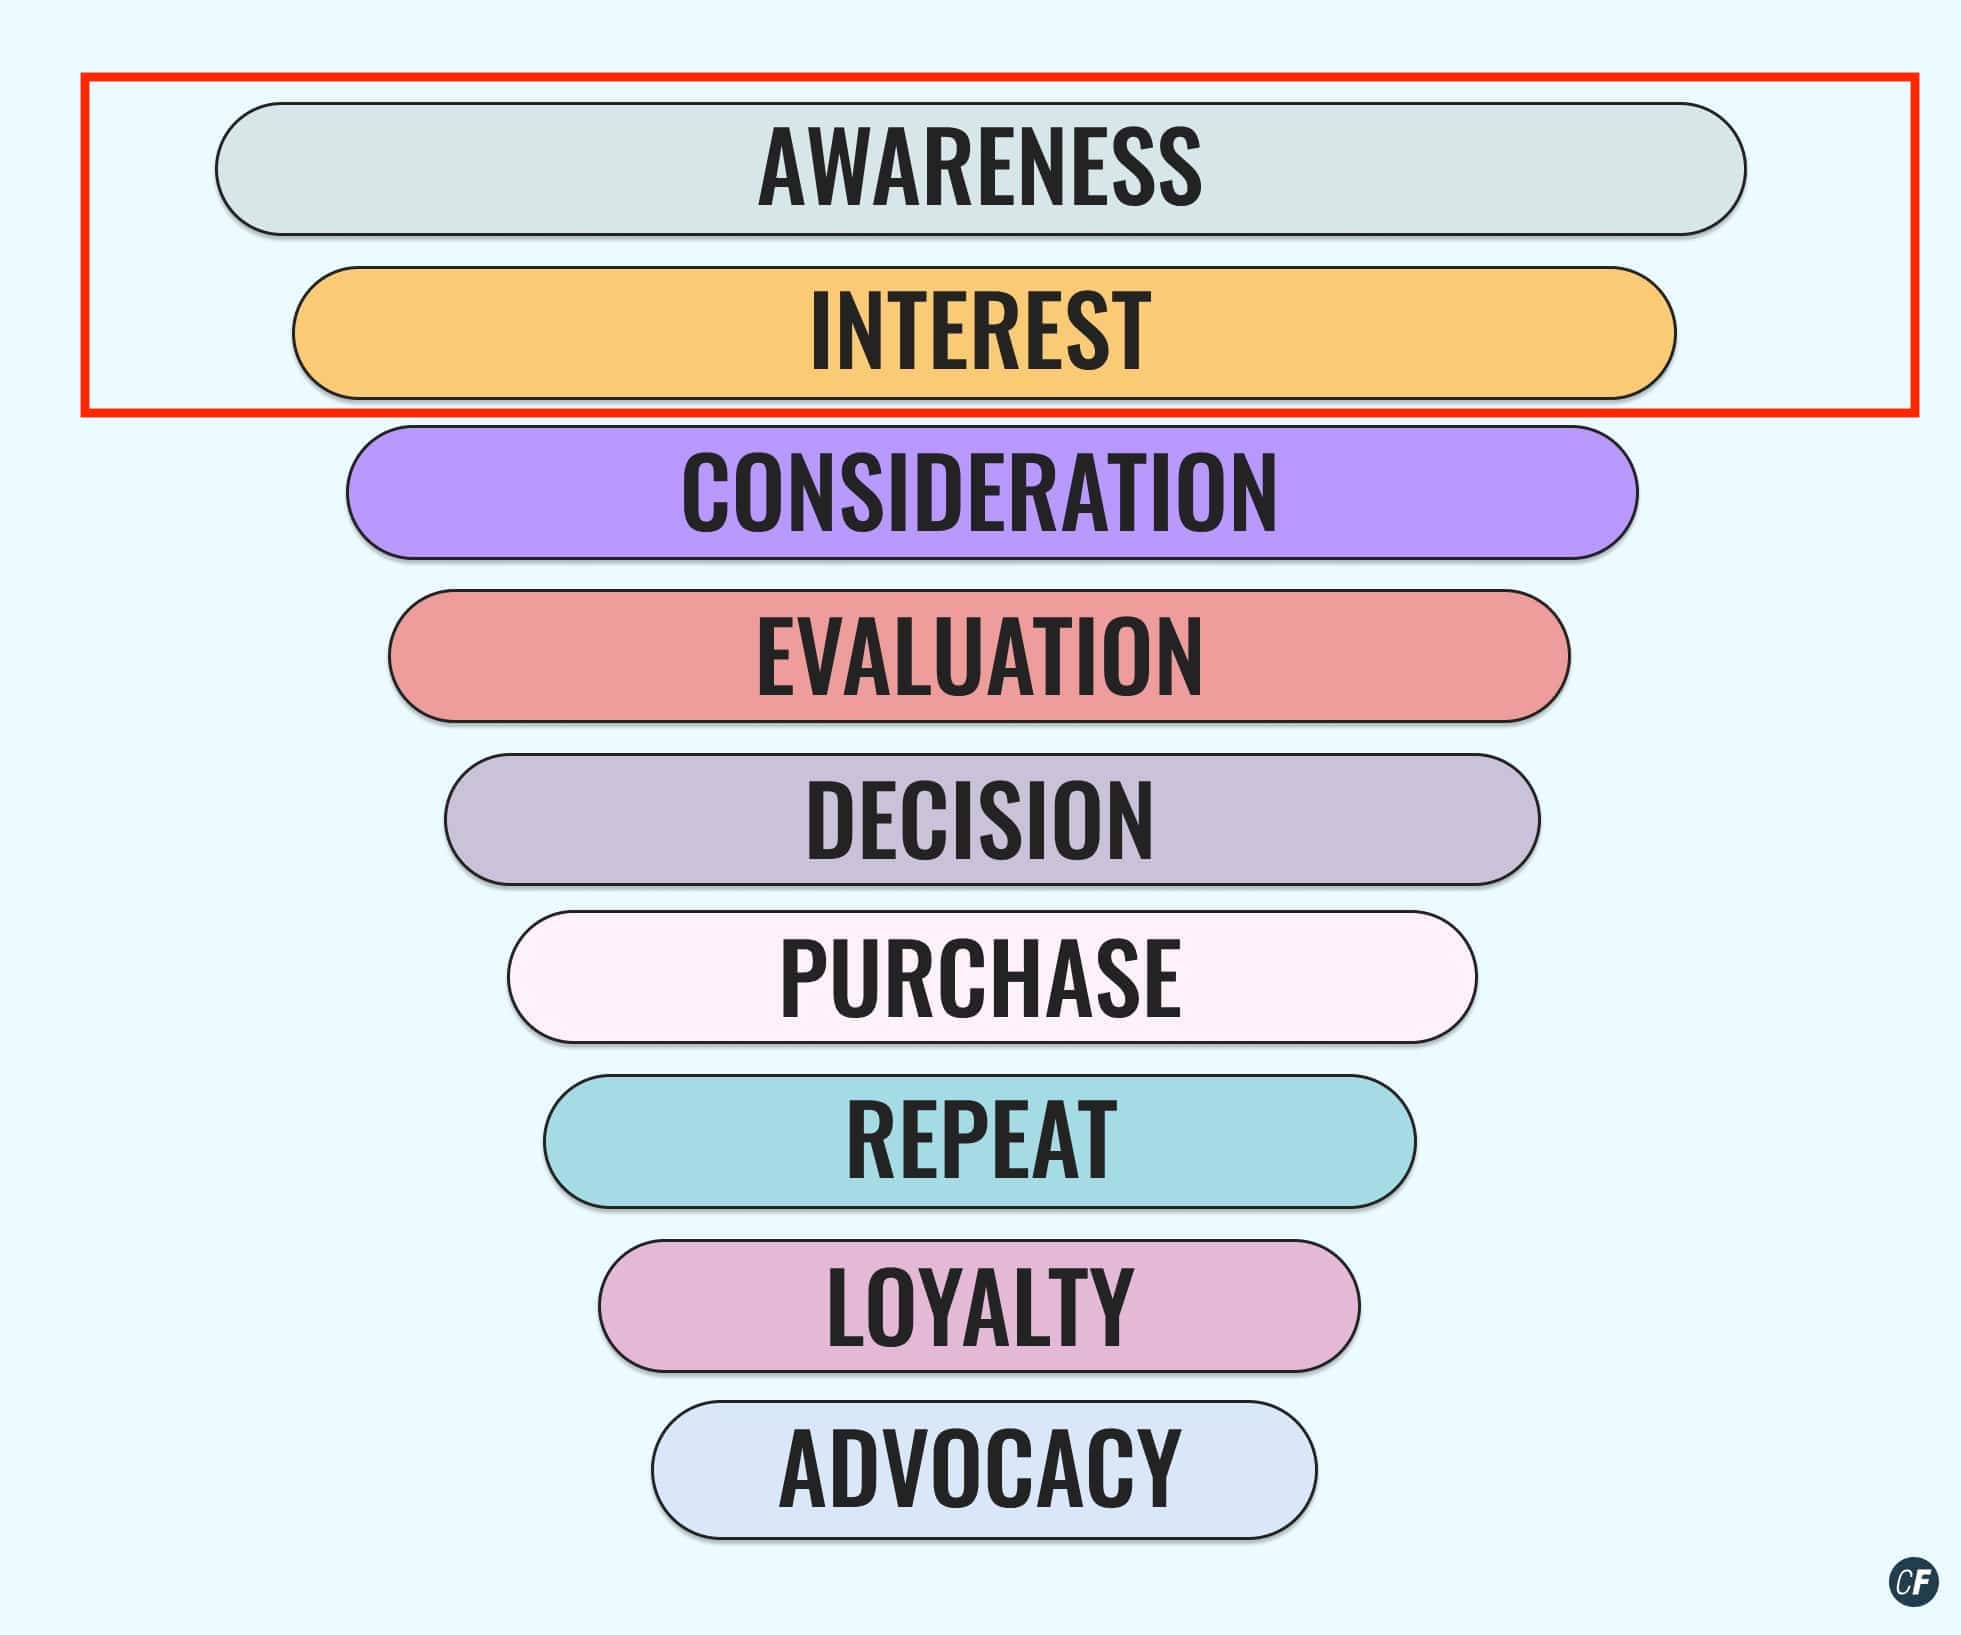
If you remember back to the marketing funnel, we had the phases of awareness and interest at the top. Let's find out which metrics fall into these phases.

Impressions
An impression is the term used for any kind of view of your marketing content. For paid marketing, this would mean that someone sees your Facebook image or video ad (but doesn't necessarily interact with it), or they see your paid text ad in Google Search.
If you're a social media marketer, it would mean that your post has been viewed in someone's feed, while if you're an SEO manager, it means that your content has been viewed among Google's search results.
Impressions are the pennies and cents of the online marketing economy—there are a lot (really, a lot) of them, and they aren't (normally) very valuable. It's important to remember, however, that an impression in one channel can still be much more valuable than an impression in another.
A few seconds of a video view on YouTube or Facebook is considerably more valuable than appearing as near-monochrome, homogenous text among ten other search listings. On its own, this difference is imperceptible. At the scale of millions, this difference can really have a tangible effect.
To conclude, impressions almost certainly won't be your KPI in any channel, but they almost certainly will constitute a metric worth measuring and monitoring. Why? Well, because the more impressions you get, the more clicks and visits you'll get…
Clicks
If an impression is required to generate awareness, a click is what first demonstrates awareness. This click will have different results depending on the channel. If a user clicks on an ad, they'll likely be taken to a landing page which directly offers a product or service.
A click on a social media post will probably result in some kind of deeper engagement—a like, comment, share, or perhaps a visit to the company's profile and website. A click on in the search listings will more often than not take a user to a blog post—something information-heavy and optimized for people looking for answers.
From the metrics of impressions and clicks, we can generate a raft of other metrics, including CTR, cost per impression, and cost per click.
CTR
CTR stands for click-through-rate, and is calculated by dividing the number of clicks by the number of impressions. It's essentially a measure of how relevant and how attractive your content or creative is. A higher CTR means more people who are seeing your content are displaying an interest in what you offer.
As we've already discussed, there's a balance here—overpromise and make your ad too attractive and not relevant enough, and you'll see poor performance further down the funnel. Make it hyper-relevant but not attractive, and you'll have a low CTR, which, on the paid channels, typically leads to a high CPC, or cost per impression and cost per click. On the organic channels, such as Search and Social, this approach is doomed to fail spectacularly.
Cost per Impression
In the paid channels, this is the cost of the campaign divided by the number of impressions. Impressions are plentiful and cheap, and the cost per impression is not something many digital marketers will monitor closely.
Cost per Click
The cost per click, or CPC, on the other hand, is almost always a metric to be scrutinized. This is the cost divided by the number of clicks. The paid marketer's goal will be to lower the CPC while trying to ensure that the users clicking on the ad will be interested "enough" in the product or service offered. They will frequently modify the imagery and messaging as they maximize and balance attractiveness and relevance to find their elixir ✨
5. Mid-funnel metrics
So you've captured someone's attention. What happens next? Let's keep moving further down the funnel!

Leads
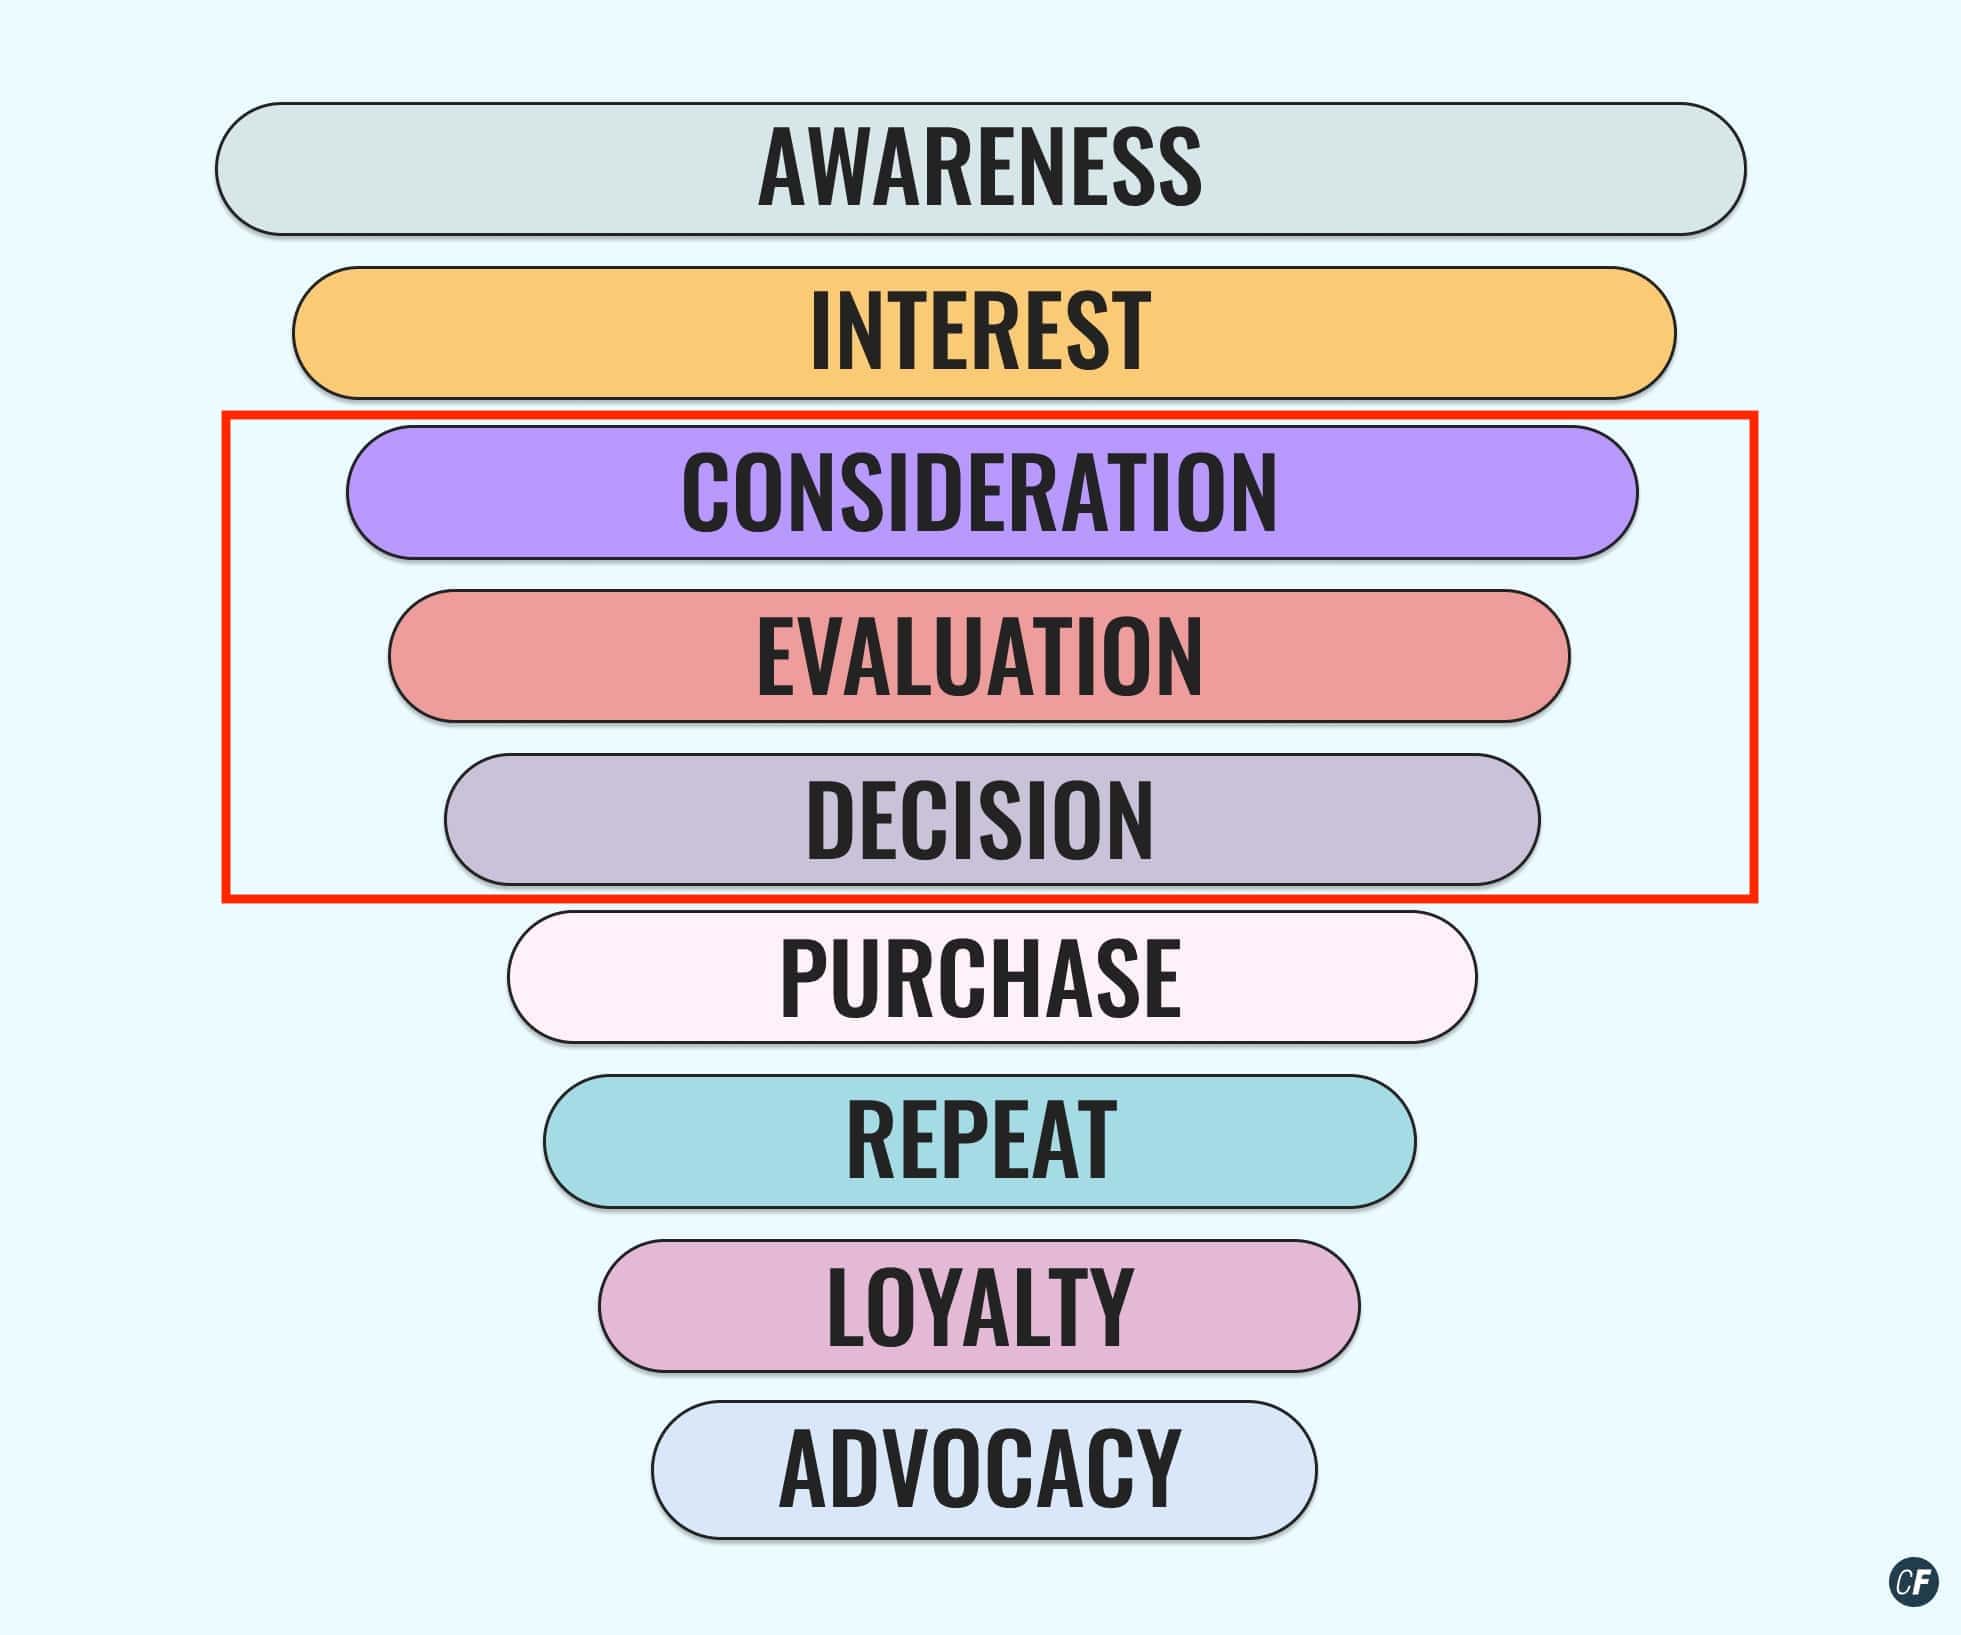
Moving down the funnel from interest to consideration and evaluation, we have the lead. A lead is created when a user enters some of their personal details—typically their name and email address—into a form on the website.
They'll normally do this in return for something, or in order to achieve something; creating an account, signing up for a newsletter, saving some settings or progress, downloading a free guide or ebook…the list is as endless as the marketer's imagination ✨
Leads are very often a KPI, or at least an important secondary metric, for paid marketing managers, and they may well be a KPI for content marketing, social media and SEO managers too. They're often the highest level metric with a business value attached, and marketing managers will often have a good idea of how many of their leads will convert into sales.
Many companies have different categories of leads, such as Marketing Qualified Leads (MQLs) and Sales Qualified Leads (SQLs). These categories represent a different quality of lead, meaning those leads which are more progressively more likely to buy. To fall into one of these upper categories, a user will typically need to have completed a particular action which indicates a higher level of interest in the product or service, such as downloading a price list or arranging a call with a sales representative.
Click-to-lead
The click-to-lead, or visit-to-lead, conversion rate is an indication of how interested the traffic to your site is in your product. It's the first expression of genuine interest in the product or service you offer, and is calculated by dividing the number of leads by the number of clicks to give you a percentage.
Marketers such as CRO (conversion rate optimization) managers are often heavily focused on improving this rate to increase the number of leads and maximize marketing efficiency.
Cost per Lead
Like the cost per impression and cost per click, cost per lead is calculated by dividing the cost by the number of leads in a given period of time. As marketers have a good idea of how many of their leads will become sales based on historical data, they generally know exactly how much they can currently afford in order to hit overall goals of profitability. Therefore, cost per lead is often a very important metric to monitor.
6. Lower funnel metrics
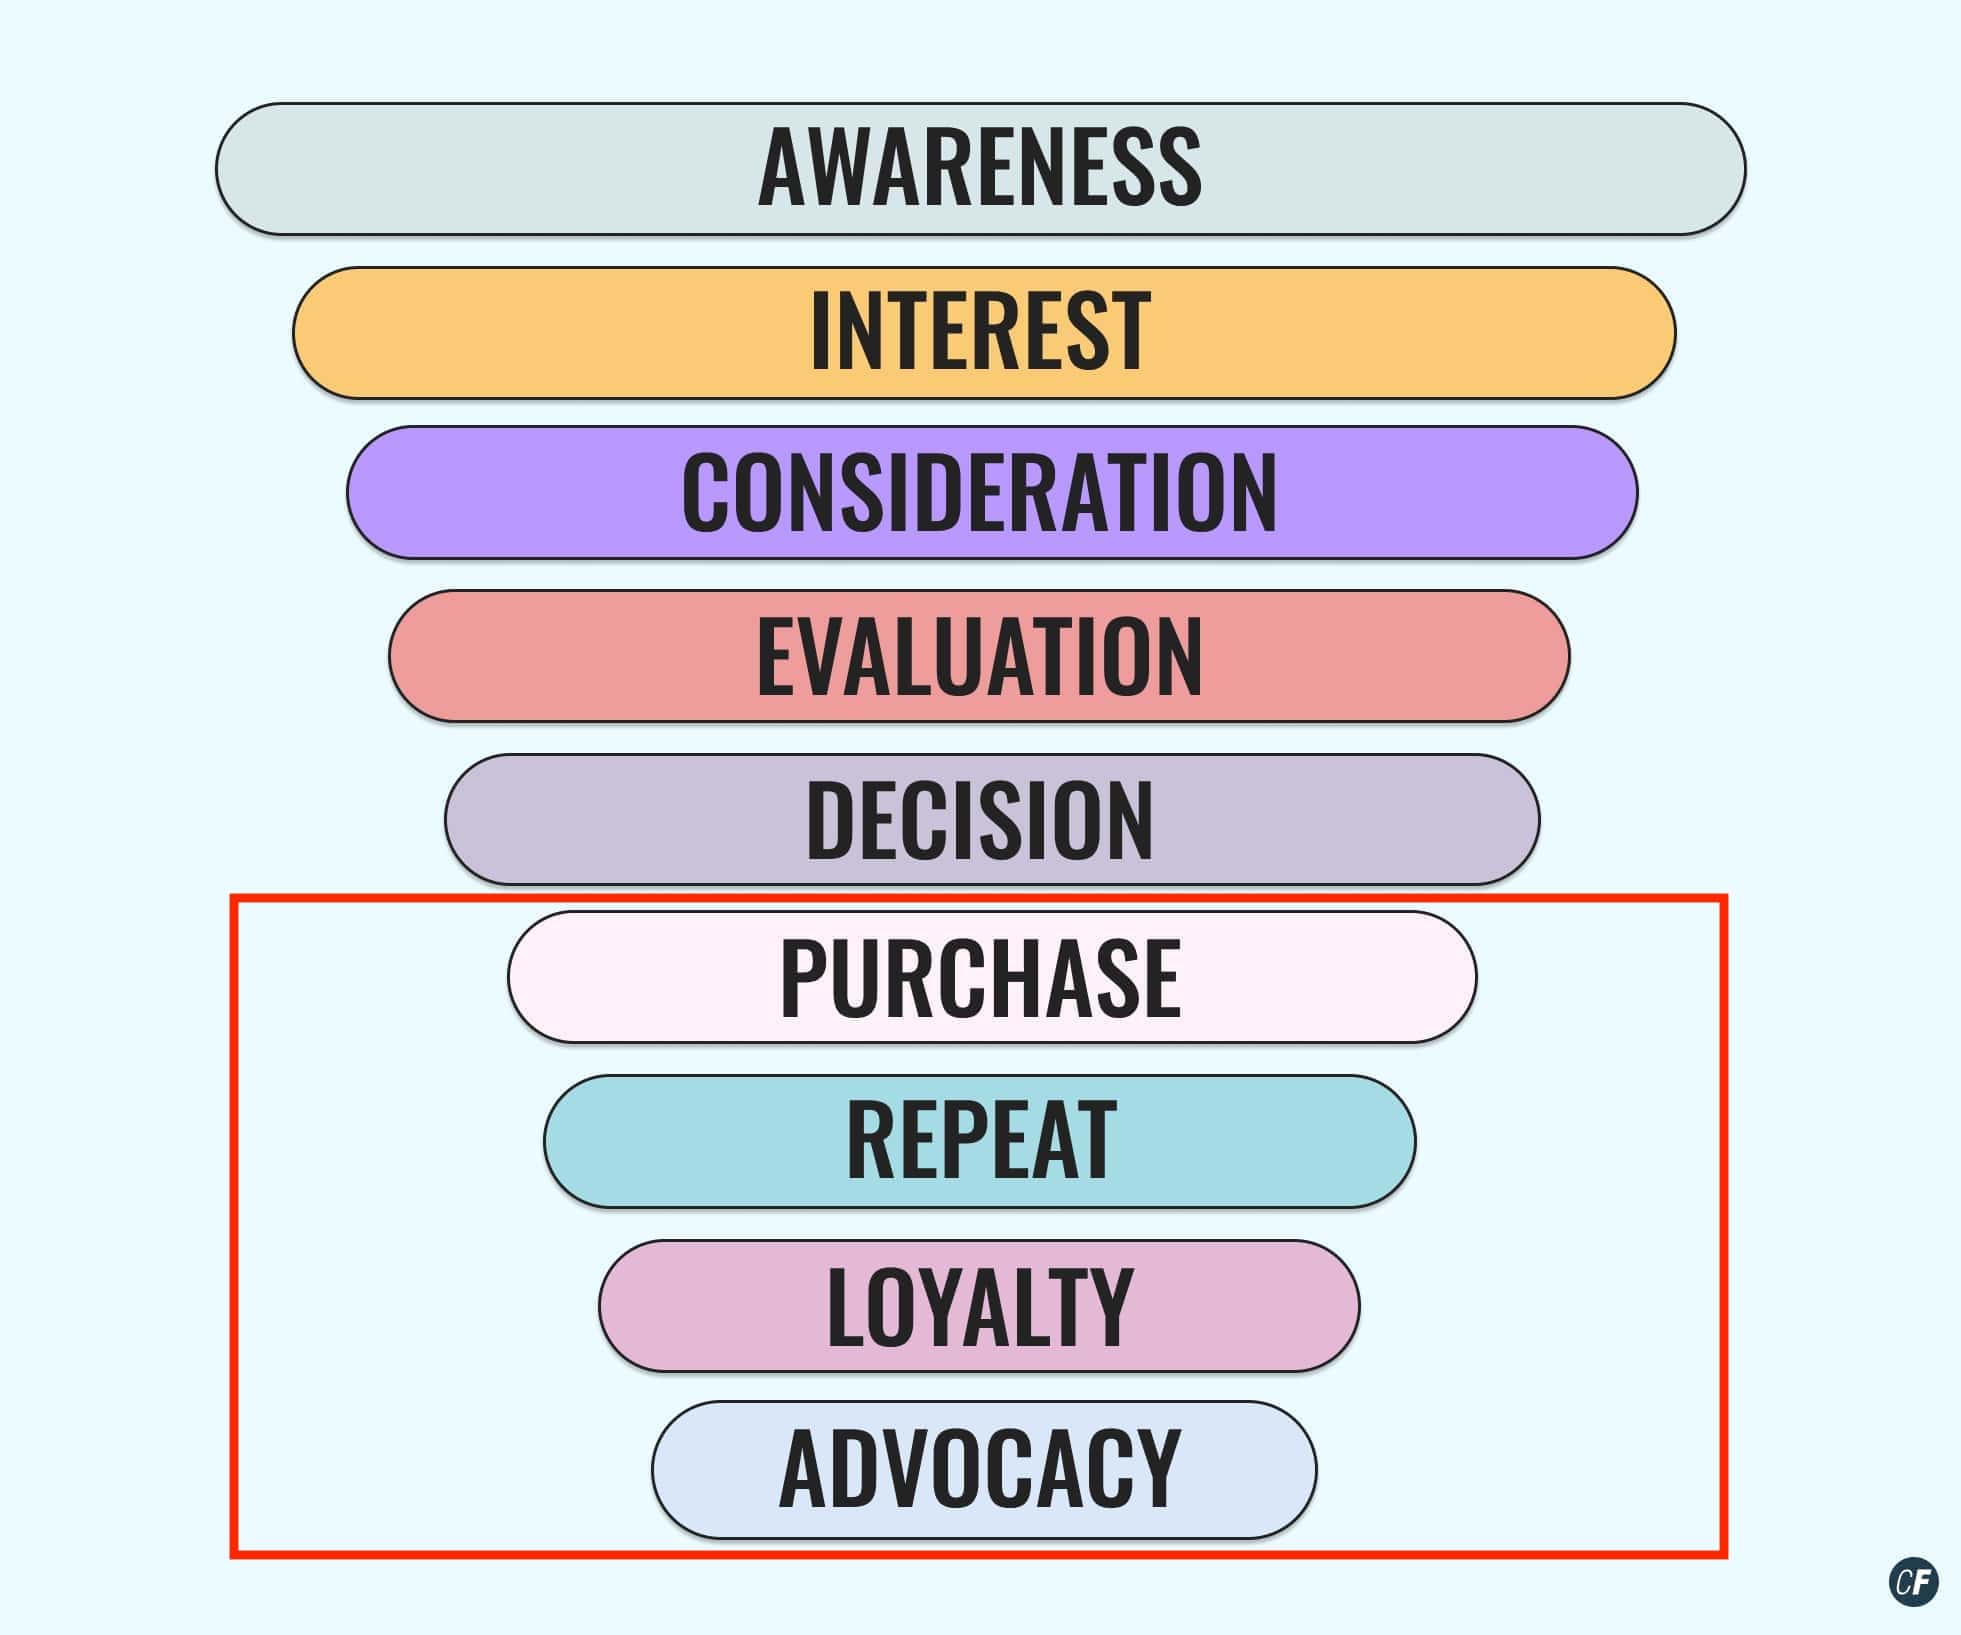
Finally, we move to the bottom of the funnel where a lead turns into a customer!

Meeting
For products with a higher price point, the objective of the marketing team may be to encourage leads to book calls with a sales team, or arrange in-person meetings. The sales representative then leverages the more personal communication to build trust and convince the lead of the product's value 🤝
Just as with the previous metrics, you can also attach conversion rates and costs to the meetings (i.e. lead-to-meeting, and cost per meeting).
Sale
The sale is often the ultimate goal for the marketing teams, and it also often represents the end of the funnel. However, this isn't always the case. Marketing teams may also bear some of the responsibility for repeat purchases, as well as loyalty and advocacy activities, like referral campaigns. Whether this is the case or not, marketing teams will almost certainly be judged on the number of sales and the efficiency with which they hit this number.
Lead-to-sale
This metric is often owned by the CRM team, which is responsible for nurturing leads through to sales through targeted and timely communications. They'll likely work in conjunction with other stakeholders, such as product marketing and sales, to constantly try to improve this conversion rate.
Cost per Sale (commonly known as the CPA or CPO)
This is the cost divided by the number of sales made within a given time.
7. Summary
Well done for making it this far! That was a heavy lesson on metrics, but now you know the difference between a KPI, an efficiency KPI, secondary metrics, and you know all about the most commonly used metrics across the marketing funnel.
Congratulations—that's quite a feat! In the next tutorial, we'll look at what makes a strong creative by reading up on a few key principles.
