Hi there,
Welcome to tutorial four of your Data Analytics for Beginners Course—the penultimate stop in our journey 😮
And what a journey it’s been! We’ve cleaned our dataset, calculated descriptive statistics, and created pivot tables. Most importantly, we’ve started to uncover some pretty interesting insights about our data, allowing us to answer the following questions:
- What are the most popular pick-up locations across the city for Citi Bike rental? Grove St Path, Exchange Place, Sip Ave.
- How does the average trip duration vary across different age groups, and over time? Average trip duration is the longest for 75+ year olds.
- Which age group rents the most bikes? 35-44 year olds rent the most bikes.
- How does bike rental vary across the two user groups (one-time users vs subscribers) on different days of the week? There are a lot more one-time users on Saturday and Sunday than during the rest of the week. Respectively, considerably fewer subscribers renting bikes over the weekend.
In this tutorial, we’ll proceed to the next step in the data analysis process: Data visualization 📊 This will help you to answer the remaining questions we set out at the beginning of the course, and to present your findings in a visual, easily digestible format. The questions we will be answering are:
- Does user age impact the average bike trip duration?
- How does bike rental vary across the two user groups (one-time users vs. long-term subscribers) on different days of the week?
By the end of the tutorial, you’ll be able to:
- Explain what data visualization is and why it’s important for the data analysis process
- Create your own data visualizations for your Citi Bike dataset (bar charts, column charts, and scatter plots)
- Answer questions four and five (as set out in tutorial 1) for the key stakeholders at Citi Bike
As always, we’ll start with some theory before getting to the hands-on part 🙌
Here’s how we’ve structured the tutorial:
- What is data visualization?
- What are some different types of data visualization?
- Recap of our findings so far
- Practical exercise: Creating your own data visualizations
- Key takeaways and further reading
Feel free to reach out if you have questions or feedback along the way! You can reply to any of the emails you've received as part of this course 😊
Ready? Let’s do this! 🚀
1. What is data visualization?
They say a picture is worth a thousand words, and this is especially true for data analytics. Data visualization (or data viz, as it’s often called) is all about presenting data in a visual format—such as a graph, chart, or map.
This is useful as it helps to highlight the most important or relevant insights from a dataset, making it easier to spot patterns, trends, and relationships, as well as outliers (data points that differ significantly from other observations in your dataset—you may remember we mentioned these briefly in tutorial two).
Data visualization isn’t just about creating pretty graphics. It’s a crucial aspect of making data understandable, accessible, and meaningful. As a data analyst, it’s your job to find insights within the data and share them with others—others who can act on those insights without necessarily being data experts themselves. As such, data visualization is a storytelling tool; a way to communicate your findings to a wider audience.
What’s an example of data visualization?
The Fitbit app is a great example of data visualization in action. It visualizes data in a way that anyone can understand—you don’t need to be an expert to make sense of it!
In the following screenshot, you can see a visualization for the Fitbit user’s daily steps, tracked over the course of a week. And, in the screenshot beneath that, you can see a visualization for the user’s daily sleep score. See how they use charts to present key health and fitness stats in an instantly-understandable format?
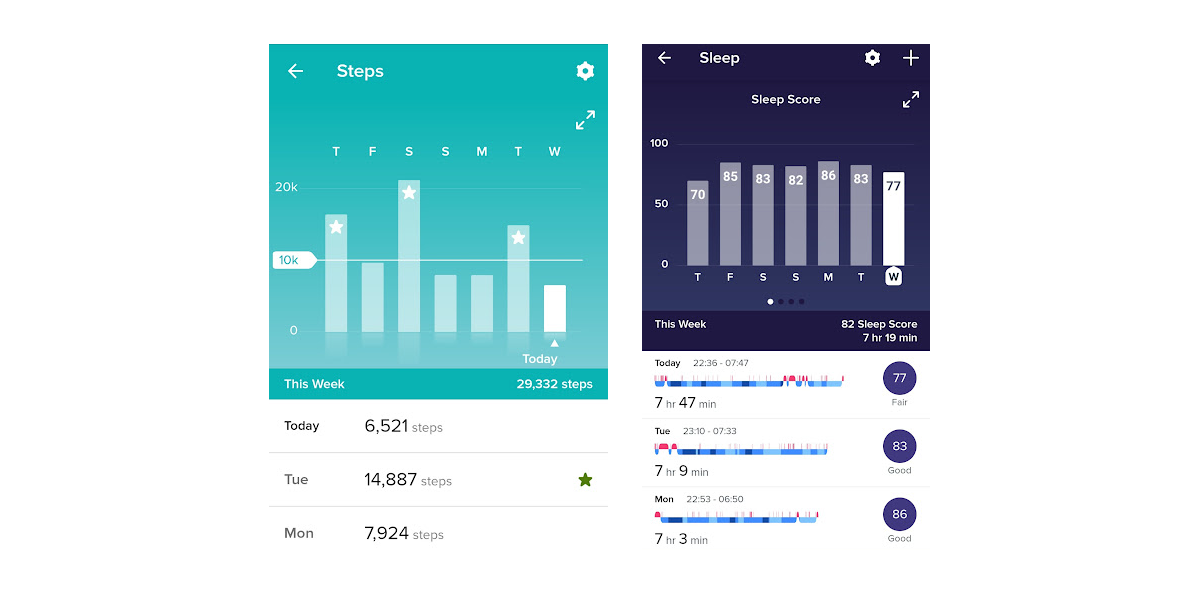
At a glance, you can see that Saturday was a very active day, compared to Sunday and Monday which appear to have been a bit more sedentary. You can also see that, while Friday and Monday were especially restful, this Fitbit user is actually rather consistent when it comes to their sleep!
Next up, we can see a visualization for the Fitbit user’s heart rate during a workout.
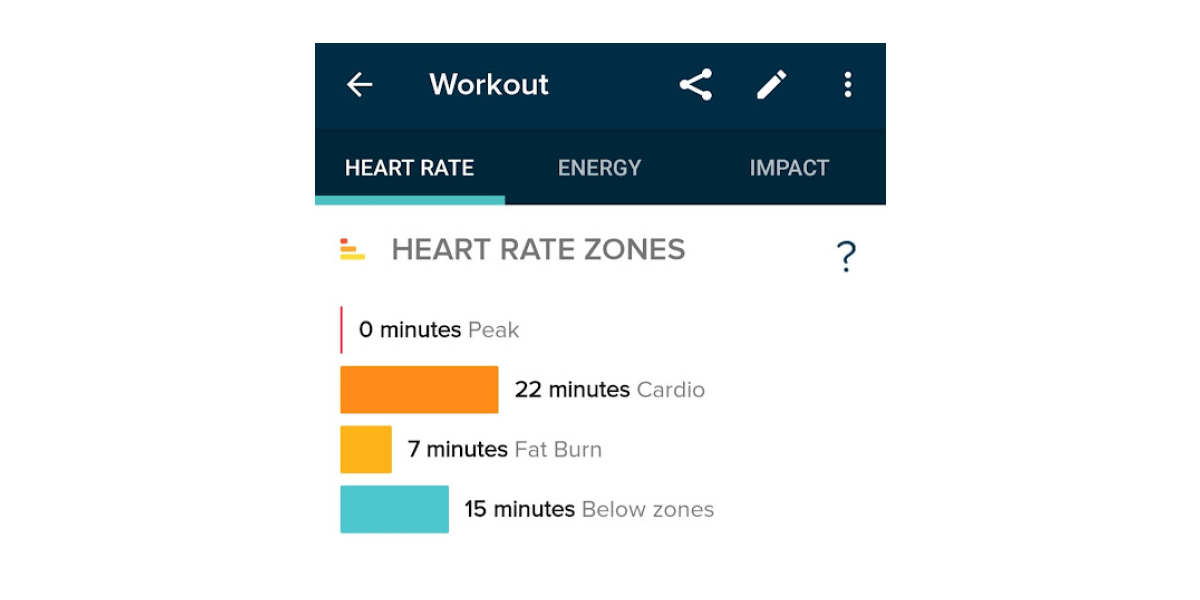
Here you can see that the majority of this particular workout consisted of cardio.
All those insights at a single glance, without having to look at any raw data! That’s the power of visualization 🤩
Now we know what data visualization is, let’s take a look at the different types of data visualization.
2. What are some different types and examples of data visualizations?
Data visualization can be either exploratory or explanatory.
As we covered in tutorial three, exploratory data analysis is all about the initial investigation of your dataset—beginning to understand and summarize its main characteristics. Data visualizations are a great tool for this, as they can literally transform thousands of spreadsheet rows into a neat, meaningful visual.
Let’s imagine you’re conducting a study into the eating habits of people living in Berlin. As part of your exploratory analysis, you’re curious to see how your sample population is split in terms of vegan, vegetarian, and meat-based diets. You have data for over 3,000 people in a spreadsheet, so you need to summarize it somehow. In this case, you might visualize your data as a pie chart, like so:

Just one look at your pie chart tells you that most of your sample population are following a vegan diet, with meat-eaters far outnumbered by vegans and vegetarians. So simple, yet incredibly insightful!
This is an exploratory data visualization as it simply summarizes and describes an aspect of the dataset in some way—it’s not telling you anything about why this might be the case. Exploratory data visualization simply highlights any patterns or trends that might be worth investigating further.
Explanatory data visualization, on the other hand, comes towards the end of the data analysis process when you’ve conducted rigorous analysis and are ready to communicate and share your findings. At this point, you know the story behind (or within) your data and you create visualizations to help you tell the story to others.
Explanatory visualizations capture the main points you want to convey. In other words, what’s the key message, or key messages, behind your data that you want to share with your audience? What should their immediate takeaway be when they see your data visualizations?
As Cole Knaflic, author of Storytelling With Data, explains, it’s about highlighting only the most important insights 💎:
“It can be tempting to want to show your audience everything, as evidence of all the work you did and the robustness of the analysis. Resist this urge. You are making your audience reopen all of the oysters! Concentrate on the pearls, the information your audience needs to know.”
So: Exploratory data visualizations look at the “what:” they help to summarize your data and highlight patterns or trends of potential interest. Explanatory data visualizations look at the “what” and the “why:” they represent the story you want to tell after you’ve delved deeper into the data and drawn solid conclusions.
What are some examples of data visualizations?
We’ve already explored some data visualization examples with our screenshots from the Fitbit app and our eating habits pie chart. But there are other types of data visualization out there. Some of the most common include:
- Pie charts
- Scatter plots
- Bar/Column charts
- Geographical maps
- Box plots
- Area charts
- Histograms
- Venn diagrams
Each different type of visualization has different use cases depending on the variables you are visualizing. We explain each of these data visualization types (with examples) in this guide: 13 of the most common data visualization types and when to use them.
For now, though, let’s make our way to the practical part of today’s tutorial—starting with a quick recap of our main findings so far.
3. Recap of our findings so far
In the previous tutorial, we identified the 20 most popular locations for NY Citi Bike rental (with Grove St. Path coming in top!), and discovered that the most frequent users of the NY Citi Bike service fall into the 35-44 age range. We also found that users in the 75+ age category take the longest trips on average! We also saw that Wednesday is the most popular day of the week overall for bike rental, with long-term NY Citi Bike subscribers being more active during the week than on weekends 🚴
We’re starting to get a picture of how NY Citi Bike usage varies across different users and locations, and at different times. In fact, we’ve answered the first three of our five main questions, and started to answer the fourth. Not bad!
Now we’re going to delve even deeper with data visualizations, with the goal of visualizing our key insights from tutorial three and answering our two remaining questions:
- How does bike rental vary across the two user groups (one-time users vs long-term subscribers) on different days of the week?
- Does user age impact the average bike trip duration?
Ready to get practical? Here we go!
4. Practical exercise: Creating your own data visualizations
Now you’ve covered the fundamentals of data visualizations and when to use them, it’s time to create your own in Google Sheets. For this practical exercise, you’ll be working exclusively with the new sheets you produced in tutorial three when creating pivot tables (remember when we copied the output of each pivot table into a blank sheet?) If you got stuck on the previous tutorial, you’ll find everything you need to continue in our version of the dataset here. We’ve called this version “New York Citi Bikes_v3.” Use it to cross-reference your own results from tutorial 3, or make a copy to use for today’s practical exercise.
Data at the ready? Great 😊 Now let’s begin.
Task 1: Create a bar chart for the top 20 NY Citi Bike pick-up locations
We’ll begin with one of the staples of visual analysis: the bar chart. Bar charts are great for presenting categorical variables in an easy way. Categorical variables are non-numerical variables that take on a fixed value (for e.g. blue, red, or green). In our case, “Start Station Name” is a categorical variable.
In the previous tutorial, we created a pivot table to highlight the top 20 most popular locations for picking up a NY Citi Bike. We now want to visualize this so it’s easier to draw comparisons between the popularity of the top locations.
- Open your dataset (here’s a link to ours for your reference) and navigate to the sheet named “Task 2.1. Top 20 pick-up locations.” Select both columns A and B, down to row 21 (as we’re only interested in the top 20 stations):
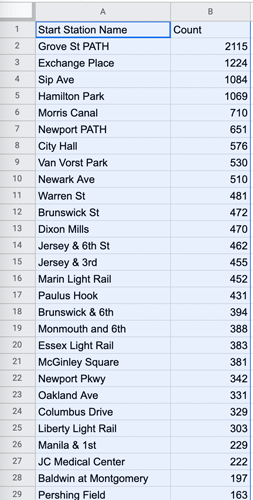
Figure 1. - Click the “Insert” menu option on the ribbon, and then select “Chart” from the dropdown.
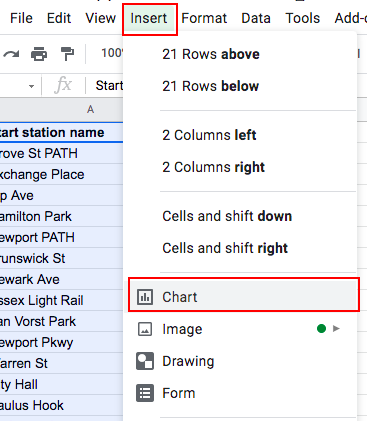
Figure 2.
Google Sheets may automatically produce the chart it considers most suitable for the data selected. In our case, it suggests (and creates) a pie chart. However, we want to create a bar chart, so we’ll change the type of chart selected. To do so: - Navigate to the “Chart editor” on the right hand side, then click the down arrow under “Chart type” and select “Bar chart.”
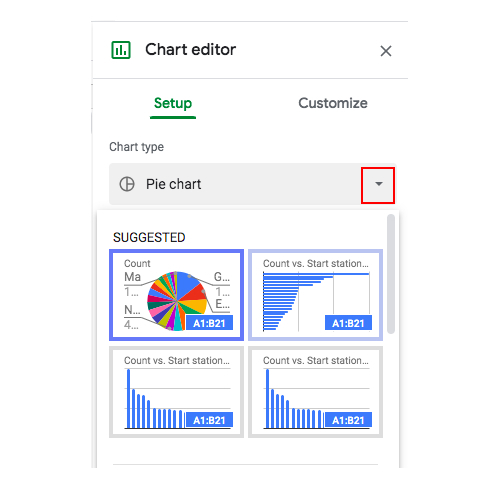
Figure 3.
You’ll get a chart that looks like this: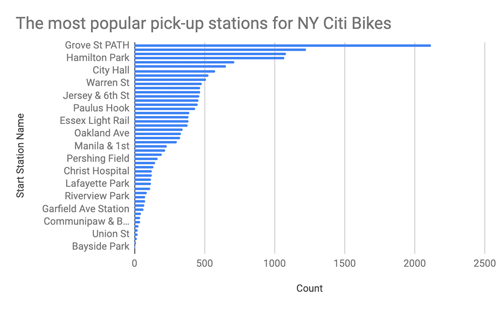
Figure 4.
*Tip 💡: We’ve customized the title of our bar chart. If you’d like to do the same, go to the “Customize” tab in the chart editor, expand the “Chart & axis titles” menu, and type your new title in the “Title text” field: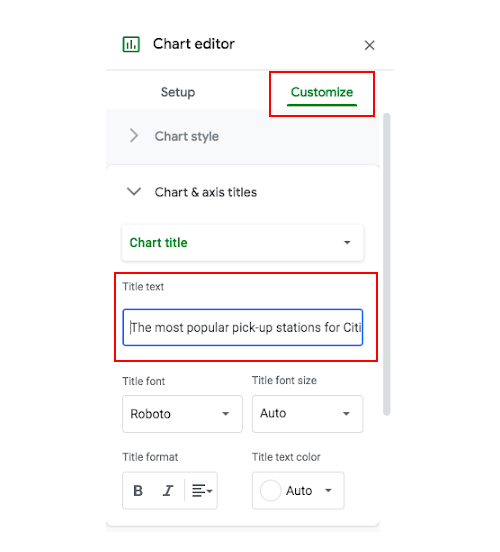
Figure 5.*
Excellent! 🤸 We now have a visual representation of the most popular Citi Bike pick-up locations. You can clearly see that Grove St Path is the most popular station by far, as it has the longest bar. It’s so much easier to perceive this information in chart form, isn’t it?! That’s the beauty of data viz 😍
Let’s move onto our next visualization: the column chart.
Task 2: Create a column chart showing average trip duration across different age groups
As you can see, producing visualizations in Google Sheets is fairly straightforward. You’ve already gotten the hang of it! It’s always a matter of choosing which data you want to visualize—whether it’s summarized data from a pivot table in a separate tab, or data straight from the original dataset. Either way, you just need to select a data range, press “Insert → Chart” and then use the chart editor to choose the type of visualization you want to use.
Remember the first part of question two—How does the average trip duration vary across different age groups? We already summarized the relevant data with a pivot table in tutorial three, so now we’re going to visualize it using a column chart:
- Navigate to the sheet labeled “Task 2.2. Trip duration / age group” and select the entire range of data.
- Click “Insert → Chart” and select “Column chart” as your chart type (this may be created automatically thanks to Google Sheets’ smart suggestion feature 🤓). Your column chart will look like this:
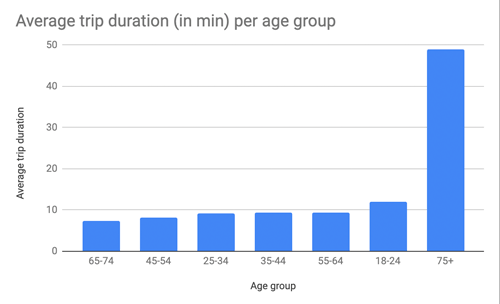
Figure 6.
And bingo! Now you can see, at a glance, that users aged 75+ take the longest bike rides on average!
Tip💡: *Keep in mind that sorting the data in the sheet in either ascending or descending order will also change the order in which the columns are presented! *
Again, you can customize the chart title (as we’ve done) using the “Customize” tab of the chart editor.
Task 3: Create a bar chart for number of bike rentals per age group
It looks like 75+ year olds are the most enthusiastic when it comes to the length of their bike trips. But does this mean they rent the most bikes? To answer our third question—which age group rents the most bikes?— we’ll create another bar chart, this time with the count of bikes rented per age group (based on the pivot table we created in the last tutorial).
- Navigate to the sheet labeled “Task 2.3 Bike rental / age group,” select the data range, and click “Insert → Chart → Bar chart.” This is what we get as a result (with a customized title):
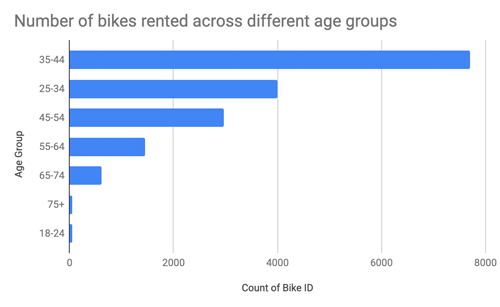
Figure 7.
Straight away, you can see that the 35-44 age group rents the most bikes, and the 18-24 and 75+ groups actually rent the least. These insights were all known to us in tutorial three, but they’re now presented so much more clearly. You could show this chart to a non-data expert and they’d immediately be able to see what’s going on!
Task 4: Produce a stacked stepped area chart for weekday and user type
Another question our NY Citi Bike stakeholders want to answer is: **How does bike usage vary across the two user groups (one-time users vs. long-term subscribers) on different days of the week? **
To create our pivot table, we counted all bike rentals per each day of the week, broken down by the variable “User type” where we distinguish between Citi Bike subscribers and one-time users. Since “User Type” is a categorical column, we can use a special type of chart in order to see these categories within the frequencies of “Bike ID”: the stacked stepped area chart. Sounds fancy, hey? 💫
- Navigate to the tab in your data file labeled “Task 2.4. User type / weekday” and select all the data.
- With the data highlighted, click “Insert → “Chart” and select the “Stacked stepped area chart” option:
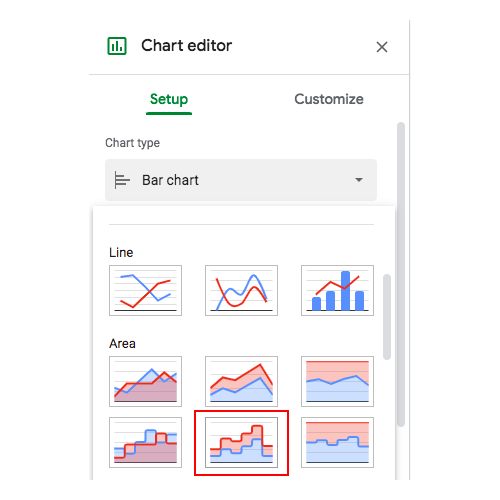
Figure 8. - Your visualization should look like this (again, we’ve customized the title to explain what the chart is showing us):
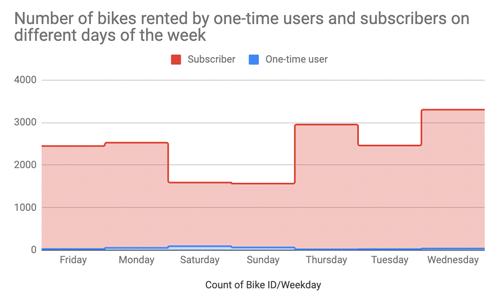
Figure 9.
The stacked area charts are indeed curious, and very useful! We can see that one-time users are much more likely to rent a Citi Bike during the weekend than they are during the week, since the blue stacks are higher for Saturday and Sunday. The opposite is true of subscribers, for whom the red stacks dip on Saturday and Sunday. And, the vast expanse of red makes it very clear that most Citi Bike users are regular, loyal subscribers rather than one-time users.
So far, we’ve created visualizations for our descriptive statistics. But, as a business, Citi Bike will be most interested in the reasons behind the facts. For example, what affects the length of trips people take on their Citi Bike? Such insights will enable them to better target their groups of interest, and to advertise more effectively.
In tutorial one, we posed the following question: Does user age impact the average bike trip duration? To answer this, we’ll be looking at whether there appears to be a correlation between user age and trip duration. Let’s take a look now.
Task 5: Produce scatter plots for age vs trip duration
So far, we’ve visualized our findings from the previous tutorial. Now we’ll seek to answer the last remaining question: Does user age impact the average bike trip duration?
As already mentioned, we’ll be looking at the relationship between different variables (also known as correlation).
To do this, we’ll create a scatter plot, plotting trip duration vs age. While we can’t draw any statistical conclusions from scatter plots alone, we can look at the trend of the data to see if there appears to be a strong correlation between one variable and another.
Creating a scatter plot is really simple—you don’t even need to create a pivot table prior to making this chart because you don’t need a summary of your data. All you need to do is:
- Navigate to the “NYCitiBikes” tab (the first tab in your Google Sheets file) and select your two columns of interest: “Age” (column J) and “Trip duration in minutes” (column M). You can do this by first clicking on column J so that all the data in that column is highlighted blue, then hold the “Command” key on your keyboard and click on column M. You should end up with both columns highlighted like so:
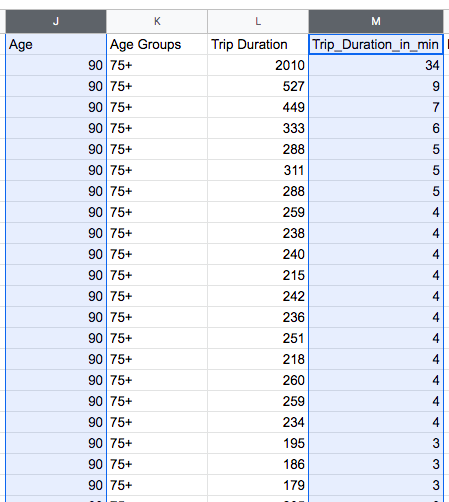
Figure 10. - With the relevant data selected, click “Insert → Chart” and select “Scatter chart” as your chart type (you’ll need to scroll down a bit to find this option in the chart editor). This is what you’ll get:
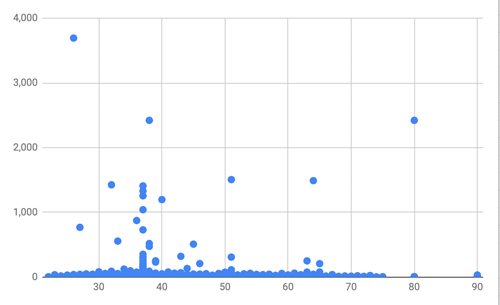
Figure 11.
On the x-axis (the horizontal axis) you can see the values for the variable “Age.” The y-axis shows the trip duration in minutes. What this plot shows us is that there’s a heavy overload of values in the lower ranges of “Trip duration,” which means that most trips are rather short, regardless of the user age. In other words, we’re not really seeing any hint of a correlation between user age and trip duration.
However, we can spot a few much longer trips (>1,000 mins) in the age bracket 30-55. Perhaps someone was visiting town for the weekend and wanted to have a bike at hand for the entire time. Expectedly, the trips the elderly took didn’t show any extremities in terms of length.
You may remember back in tutorial 3 we discovered that the 75+ age group takes longer trips on average (as discovered by calculating the mean). So why does our scatter plot seem to tell a different story? Here, we are looking at the individual, raw data points for our “trip duration in minutes” variable, rather than a calculation of the mean. The average trip duration for users over 75 is longer than for other age groups. However, the individual users who took the longest trips were in the 30-55 age range.
You’ll want to keep the chart you just created for tutorial 5, so download it and save it for later. You can do this by selecting the chart, clicking on the kebab menu (those three vertical dots in the top right corner of the chart), and selecting the “Download” option. We recommend downloading it as a PNG image:
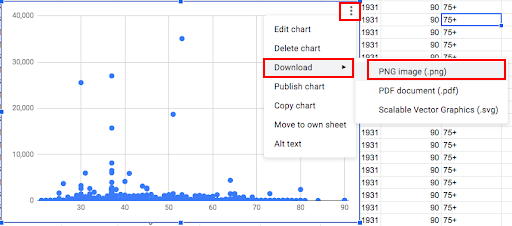
*Figure 13. *
To answer our original question: Does user age impact the average bike trip duration? With the scatter plot, we saw that there doesn’t seem to be a notable correlation between the user’s age and how long they ride for. This could be useful information for helping NY Citi Bikes customers in the long term but maybe not helpful for this analysis.
Key takeaways and further reading
That marks the end of tutorial four and your introduction to data viz 🎉 You’ve learned just how powerful data visualization can be, turning raw data into clear, at-a-glance insights that anyone can understand 📊 You’ve also mastered the art of creating all different kinds of visualizations in Google Sheets, including bar charts, column charts, line graphs, scatter plots, and stacked area charts—way to go!
To double check your work, you can click here to view a completed set of sheets.
In the next (and final!) tutorial, you’ll compile all the insights you’ve gathered and the data visualizations you’ve just created into a final presentation. This is part of data storytelling, a topic you’ll know all about soon enough!
Want to learn more about data viz? Take a look at these handy guides:
- What is data visualization? A comprehensive beginner’s guide
- A guide to the most popular data visualization tools
See you in the next tutorial! 😃
