
Hello there,
Welcome to tutorial two of your Data Analytics for Beginners Course! This is where the fun begins 😎 In the previous tutorial, we explored what a data analyst does and where a career in the field might take you. You also familiarized yourself with the Citi Bike dataset and the questions you’ll seek to answer as you analyze the data.
In this tutorial, we’re getting hands-on with the data analysis process—starting with the very important step of data cleaning.
By the end of this tutorial, you will be able to:
- Describe what data cleaning is and explain why it’s so important for data analysis
- Clean a dataset using a variety of methods, preparing it for analysis in the next tutorial
Here’s how the tutorial will be structured:
- What is data cleaning and why does it matter?
- What are some key steps in the data cleaning process?
- Practical exercise: Cleaning your dataset
- Key takeaways and further reading
If you've got feedback or questions along the way, just hit "reply" to any of the course emails you've received so far. We'll be happy to hear from you 😊
As always, we’ll link out to useful resources so you can continue your exploration of the topics we introduce. Are you ready to get stuck in? Let’s do it! 🛁
1. What is data cleaning and why is it so important?
As a data analyst, you’ll receive data from a variety of sources. This data will come in all different formats and, more often than not, it will comprise what’s known as “dirty” data. In other words, it won’t be ready for analysis straight off the bat—you’ll need to clean it first.
Before we explore the data cleaning process, let’s take a closer look at what we mean by dirty data.
What is dirty data?
Dirty data is essentially any data that needs to be manipulated or worked on in some way before it can be analyzed. Some types of dirty data include:
- Incomplete data—for example, a spreadsheet with missing values that would be relevant for your analysis. If you’re looking at the relationship between customer age and number of monthly purchases, you’ll need data for both of these variables. If some customer ages are missing, you’re dealing with incomplete data.
- Duplicate data—for example, records that appear twice (or multiple times) throughout the same dataset. This can occur if you’re combining data from multiple sources or databases.
- Inconsistent or inaccurate data—data that is outdated or contains structural errors such as typos, inconsistent capitalization, and irregular naming conventions. Say you have a dataset containing student test scores, with some categorized as “Pass” or “Fail” and others categorized as “P” or “F.” Both labels mean the same thing, but the naming convention is inconsistent, leaving the data rather messy.
We’ve outlined just three types of dirty data here. For further examples, head to this round-up of the 7 most common types of dirty data and how to clean them.
It’s important to know what kind of dirty data you’re dealing with, as this will inform how you go about cleaning it. So, whenever you receive or collect data, you’ll spend a good amount of time inspecting it in order to gauge where you need to focus your cleaning efforts 🧐
Garbage in, garbage out: The importance of data cleaning
Have you heard of the saying “Garbage in, garbage out”—otherwise known as GIGO? GIGO stems from the world of computer science, and simply means that if you put flawed data in, you’ll get flawed results out.
In data analytics, clean, quality data is essential to running meaningful and reliable analyses. Just as you wouldn’t build a house without first laying a good foundation, you can’t analyze your data without cleaning it first. Get the data cleaning stage right and you’ll create something strong, reliable, and long-lasting 💪 Do it wrong (or skip it altogether) and your analysis will soon crumble! 😱 That’s why data experts spend a good 60% of their time on data cleaning. The good news is that these days help is at hand for data analysts—various AI tools can help with data cleaning, such as Kanaries RATH.
Working with dirty data is not only bad practice; it can be extremely costly in the long run. As a data analyst, you need to be confident in the conclusions you draw and the advice you give—and that’s really only possible if you’ve cleaned your data properly.
These days GIGO is very important as well in the context of AI and Large Language Models such as ChatGPT. The cleanliness and quality of the data which the LLMs are trained is huge topic of discussion, particularly considering how powerful these models are and how influential they're becoming. Because when it was launched first, ChatGPT-3 had no experience past the year 2021, as that was as far as its training data went up to.
2. What are some key steps in the data cleaning process?
We’ve established how important the data cleaning stage is. Now let’s introduce some data cleaning techniques!
To clean your data, you might do some or all of the following:
Delete unnecessary columns
Chances are, your dataset will contain some values that aren’t relevant to your analysis.
For example, in an analysis of students’ test scores compared to hours spent studying, things like student ID number and date of birth aren’t relevant. You could simply delete the columns containing this data.
Identify and remove duplicates
Duplicate data tends to occur during the data collection phase, so it’s important to filter them out.
You’ll be removing duplicates from your dataset as part of today’s practical exercise, so we’ll show you how to do that shortly!
Deal with missing data
In the case of missing data, you can either delete the entire entry associated with it (i.e. delete the whole row which contains the empty cell), impute the missing value based on other data, or flag all missing data as such by entering “0” or “missing” in the respective cell.
Each method for handling missing data has implications for your analysis, so you’ll need to choose your approach carefully. You can learn more about how to handle missing data in this blog post.
Remove unwanted outliers
Outliers are values that differ significantly from other values in your data. For example, if you see that most student test scores fall between 50 and 80, but that one student has scored a 2, this might be considered an outlier.
Outliers may be the result of an error, but that’s not always the case, so approach with caution when deciding whether or not to remove them. You can learn more about how to detect and handle outliers on our blog.
Fix inconsistencies
As already mentioned, inconsistencies in data include things like typos and irregular naming conventions. You can fix these manually (for example, using the “Find and replace” function in Google Sheets or Microsoft Excel to locate one spelling or convention and replace it with another) or by creating a filter. You can read about how to find inconsistencies in your data in Excel in this guide.
If you’d like to learn more about data cleaning and how to approach it, we can recommend this comprehensive guide to data cleaning, together with this round-up of some of the most popular data cleaning tools used by data analysts.
For now, though, let’s move away from theory and onto practice 🏃
3. Practical exercise: Cleaning your dataset
Now let’s take what you’ve learned about data cleaning and apply it to your Citi Bike dataset. We’ll focus on:
- Identifying and removing duplicates
- Identifying and handling missing data points
Are you ready? Then let’s begin! 🚀
Task 1: Identify and remove duplicates
-
Log in to your Google account and open your dataset in Google Sheets. From now on, you’ll be working with the copy you made of our raw dataset in tutorial 1. If you haven’t yet made a copy, you can do so now—here’s our view-only dataset for your reference.
* Note: We cannot give editing permissions as this would edit the sheet for all users- you will need to create a copy with the view only and complete the steps below in the copy you created *
Google sheets is not responsive at this time on mobile devices, we highly recommend using a computer for the duration of this course. -
Now you’re going to find and remove any duplicates in your data. Select the entire dataset by clicking on the gray rectangle to the left of column A and above row 1:
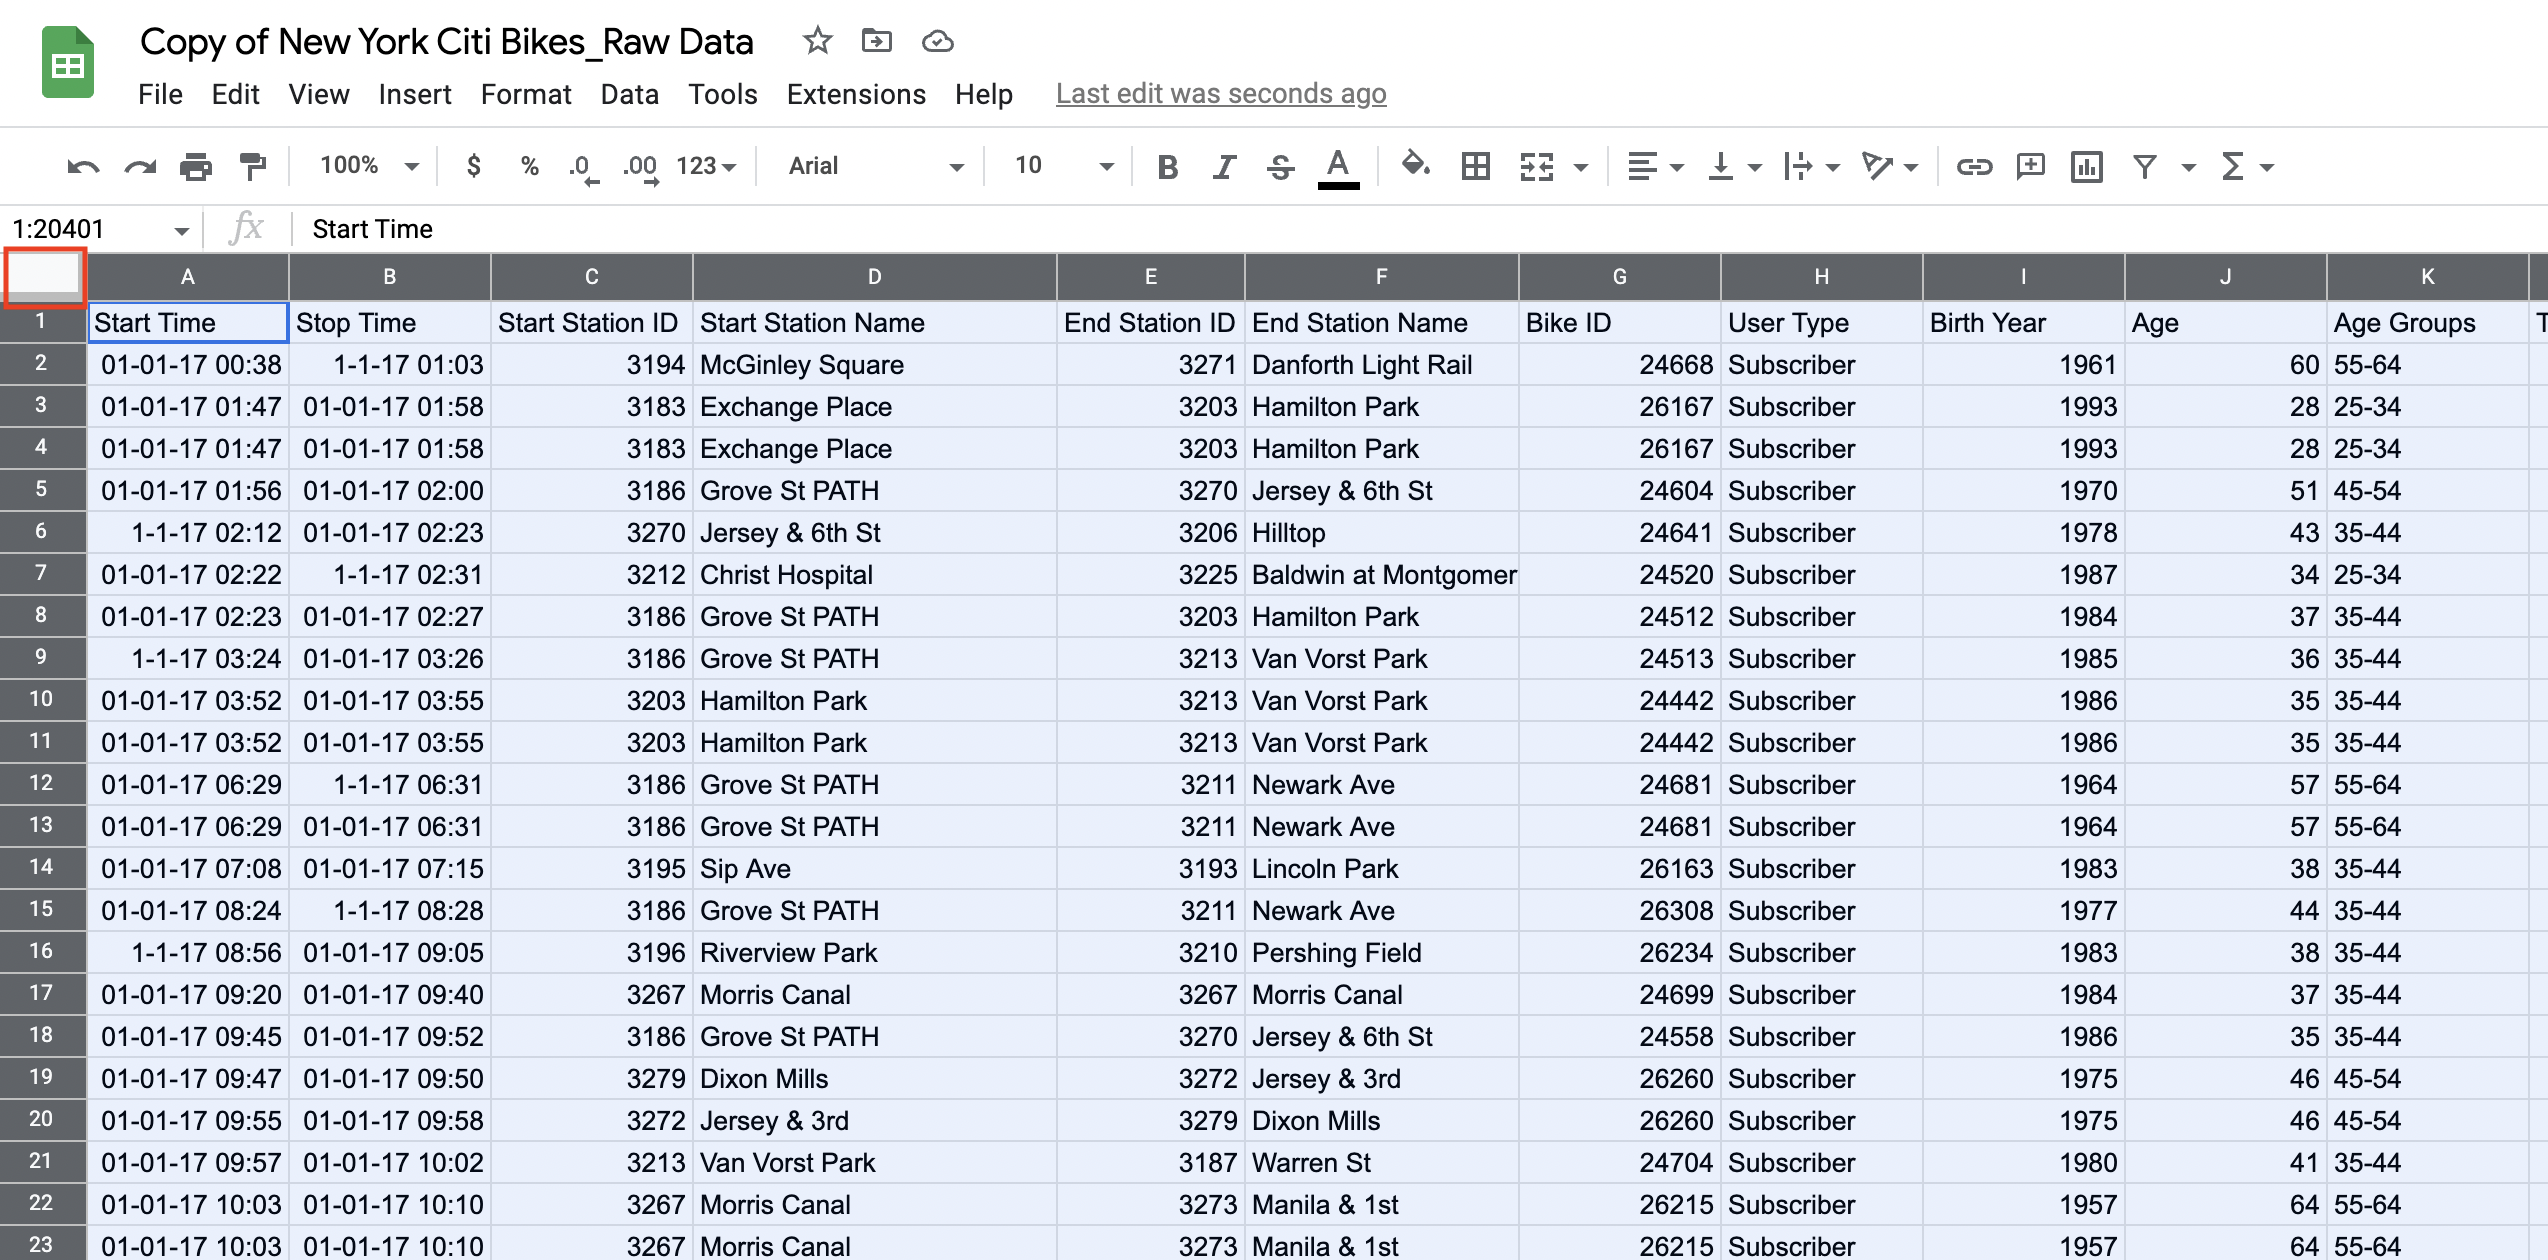
Figure 1.
Your entire dataset should now be highlighted blue. -
With your dataset highlighted, click on “Data” in the toolbar and select “Remove duplicates” from the dropdown menu:
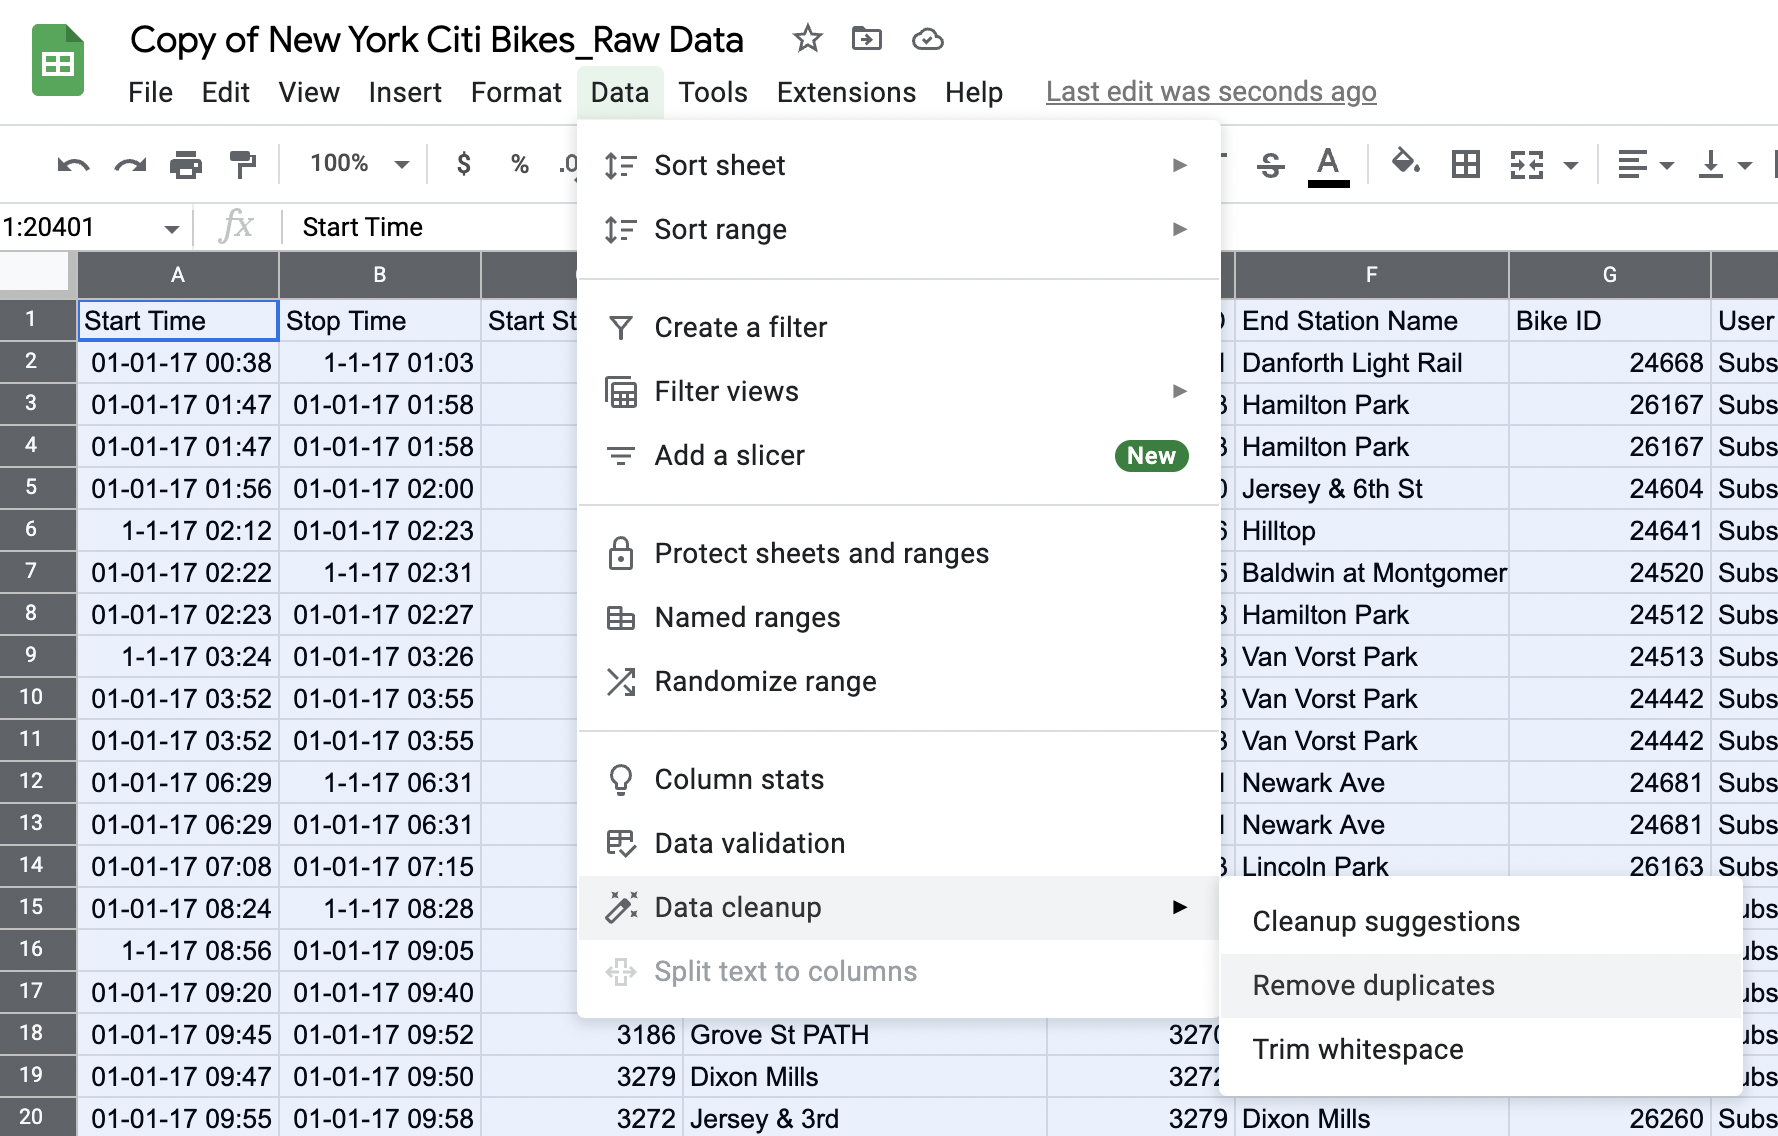
Figure 2.
The following window will pop up: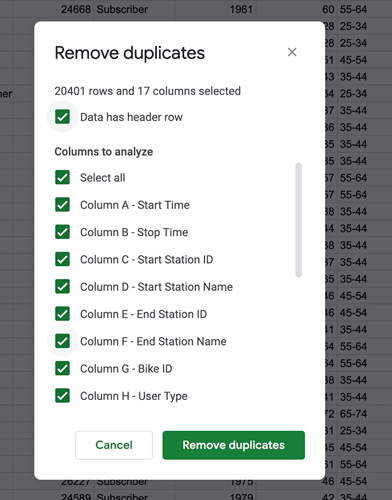
Figure 3. -
You want to search the entire dataset for duplicates, so leave all checkboxes selected and click “Remove duplicates.”
The dataset contained over 3,500 duplicate rows! So you should get this message: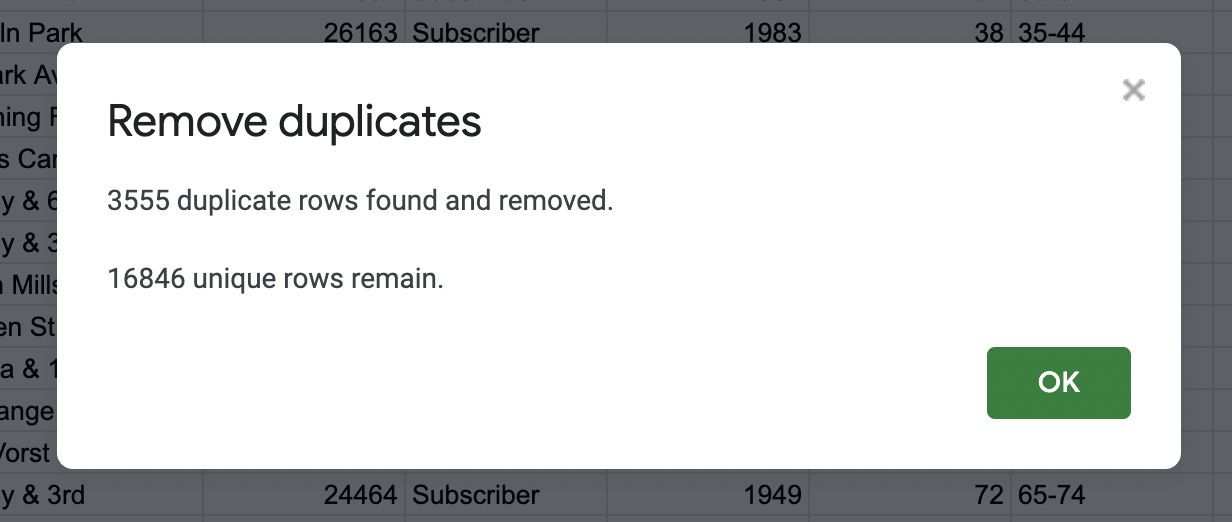
Figure 4.💡 Some things to think about: Did you have any issues with removing the duplicates? At times, files can crash for many reasons (ex. not enough space in a hard drive, file size, software space needed to run, etc.). What would be some ideas to troubleshoot this issue if your file would crash? (*Hint* to look at the File drop down and select Download to see the Excel file option)
Problems like this can be common as a Data Analyst and thinking about what else you can do to overcome these issues are essential to this career path. Using a different software or application could be one solution. Another solution could be having enough space and the most up to date software could also be another solution. Can you think of other solutions?
-
Click “Ok” and voilà! You’ve successfully removed all duplicates from your dataset. Nice work! 🙌
Because you’ve removed all those thousands of duplicate rows, you’ll be left with empty rows in your dataset. We’re going to remove those, too. So: -
Go to the “Data” menu in the toolbar and select “Create a filter” from the dropdown menu. You’ll see a funnel icon appear next to each of your column headings:
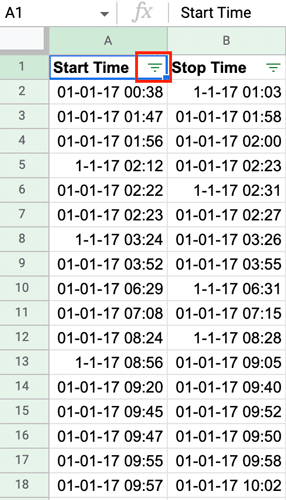
Figure 5.
You’re going to filter column A for blanks. This is simply an easy way to highlight all the rows underneath your data that are empty (the ones we want to delete). We’re deleting them now so they don’t pull through into our pivot tables later on (more on that in tutorial 3!) For now: -
Click the funnel icon in column A (Start Time) and press “Clear” to remove all the selection criteria (we only want to filter for blanks):
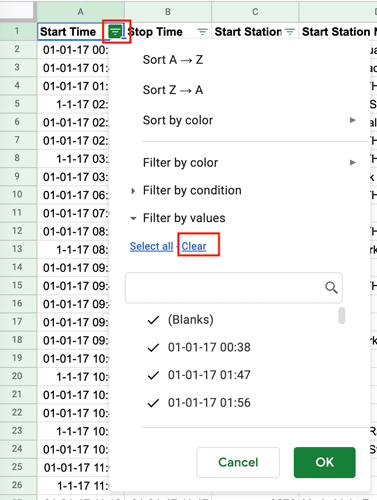
Figure 6. -
With all the default selections removed, select (Blanks). A tick should appear next to it. Then press “Ok”:
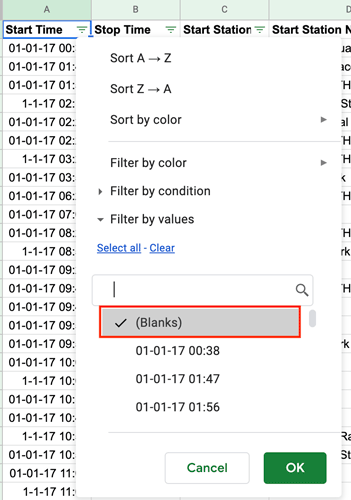
Figure 7.
* If you do not see the blank property as above, you can click on clear for all and press ok. The blank rows will still show up that way and you can continue with the next steps. (what do you think would happen if you do not delete the blanks? Answer, they could still be counted and can alter your data set)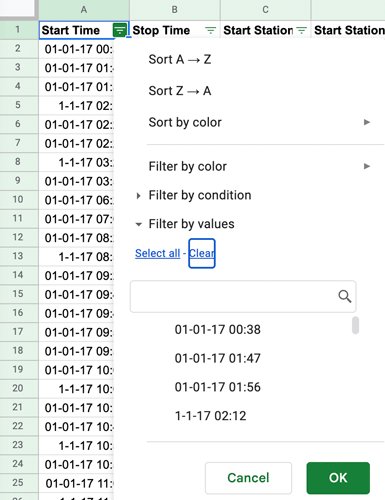
-
You’ll now see only the blank, empty rows that you want to delete (rows 16846-20401):
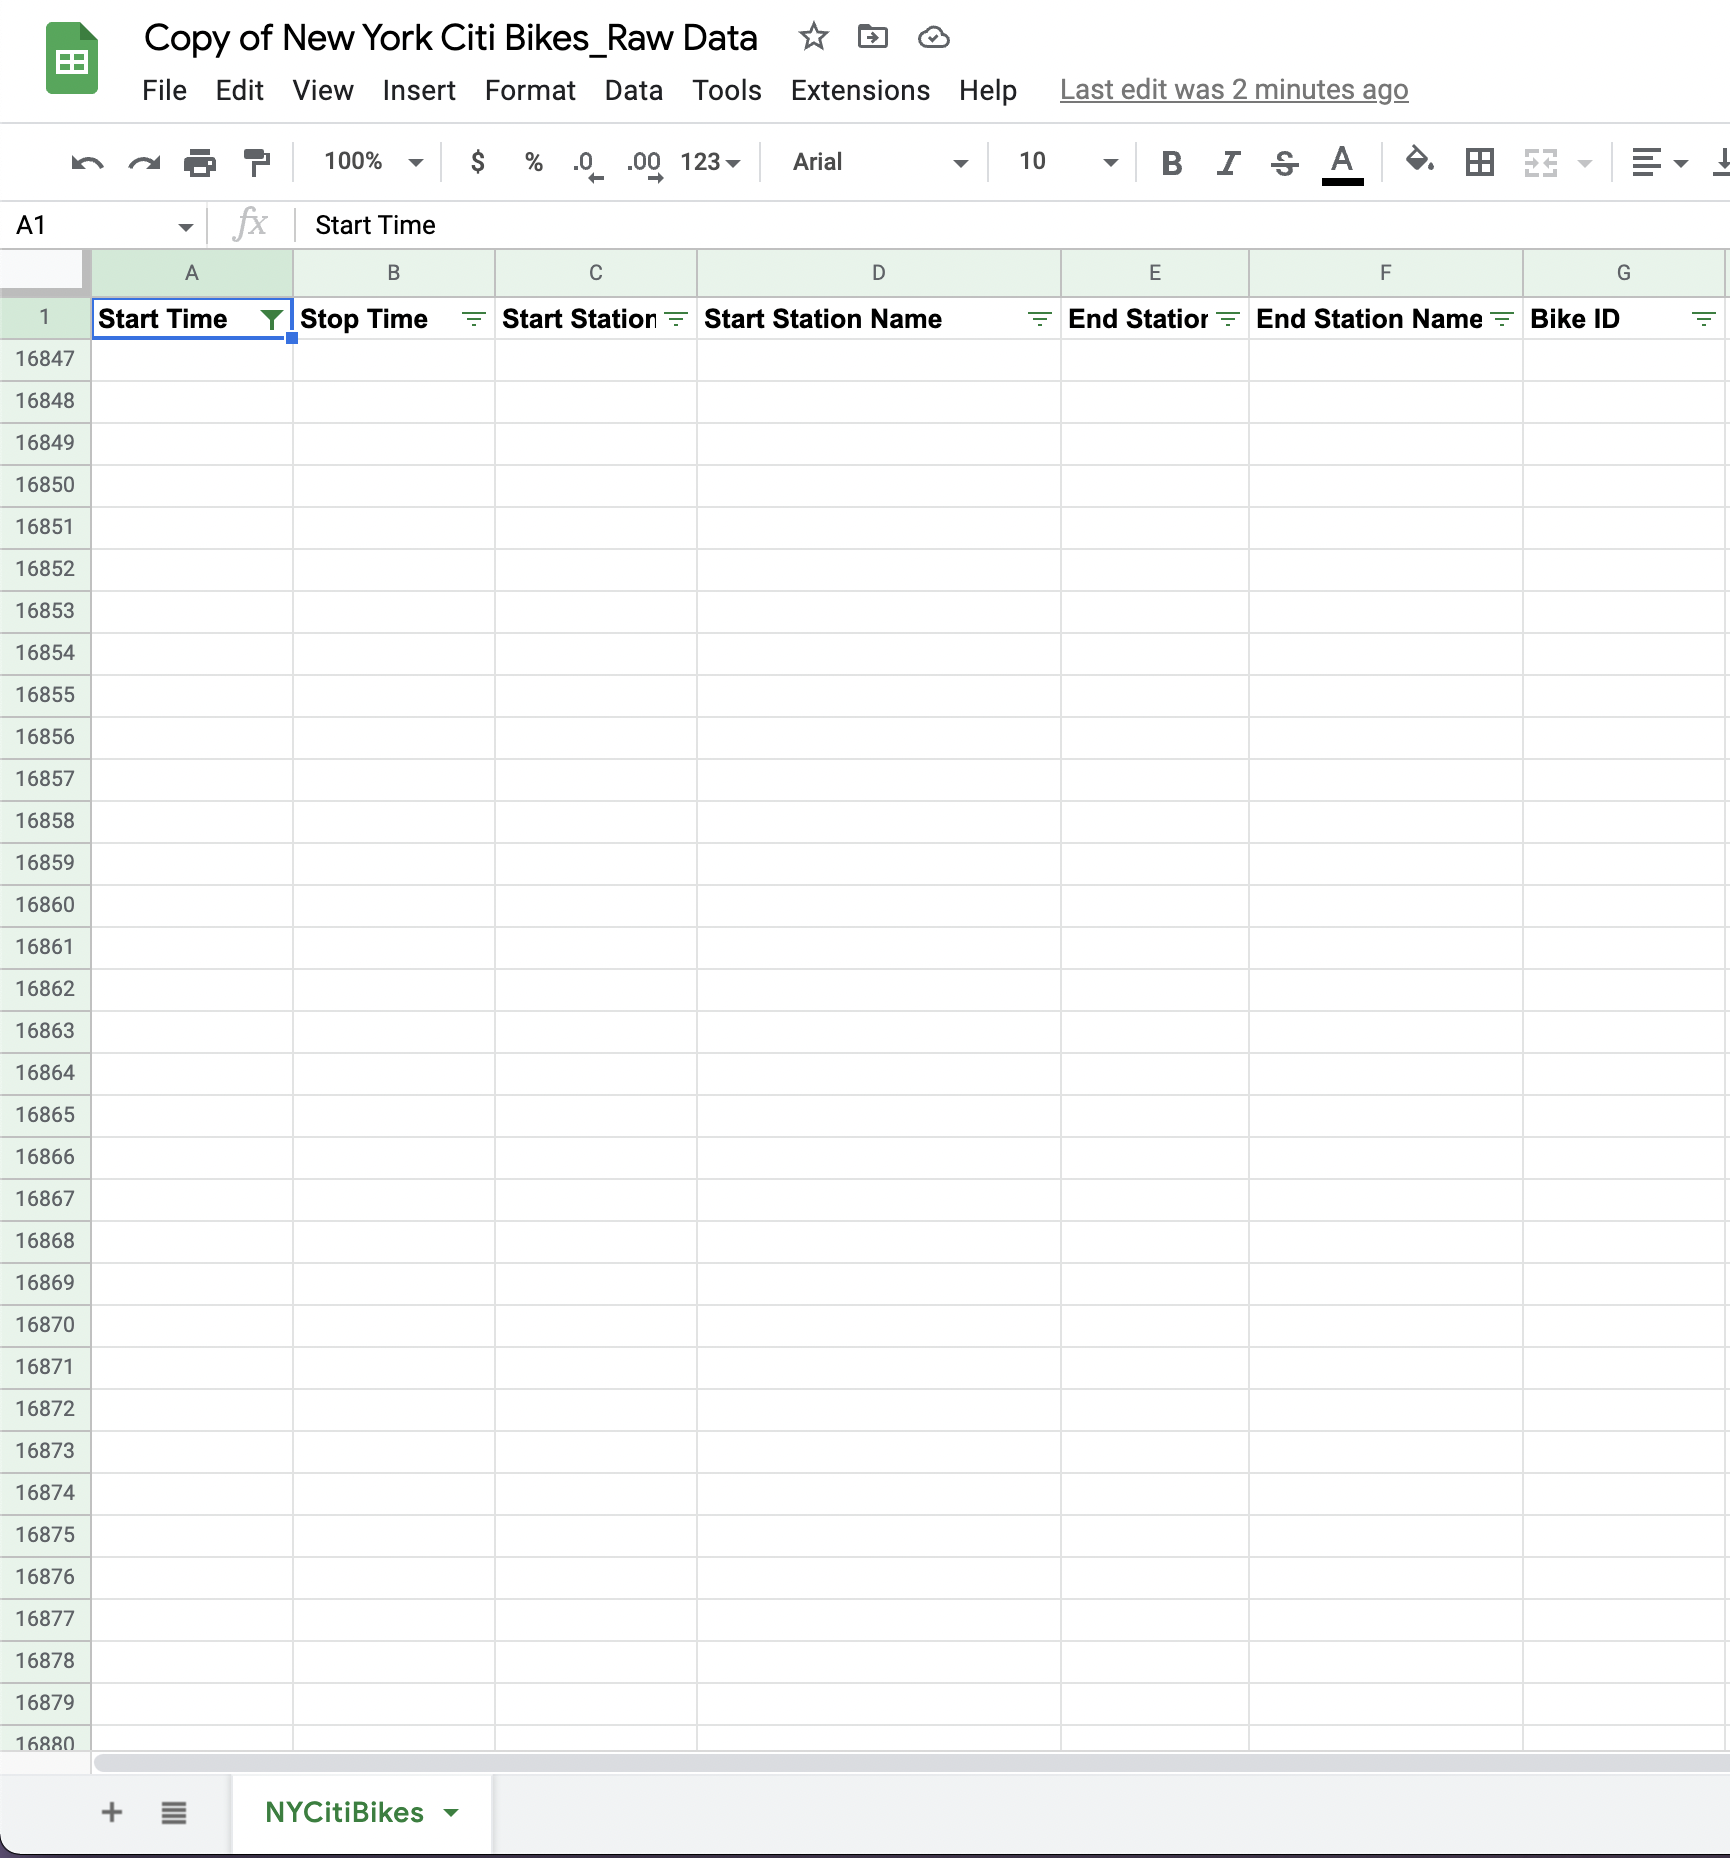
Figure 8.These are the rows you’re going to delete. Note here that you’re not deleting any data—just those empty rows that were left behind when you removed the duplicate data previously.
To delete these rows:
-
Click inside cell A:16846. Press and hold “Shift + Control”, then press the down arrow on your keyboard. This will highlight the entire column of empty cells you want to delete. Still holding down “Shift” and “Control” on your keyboard, now press the right arrow on your keyboard. This will highlight the entire range of empty rows that need to be deleted:
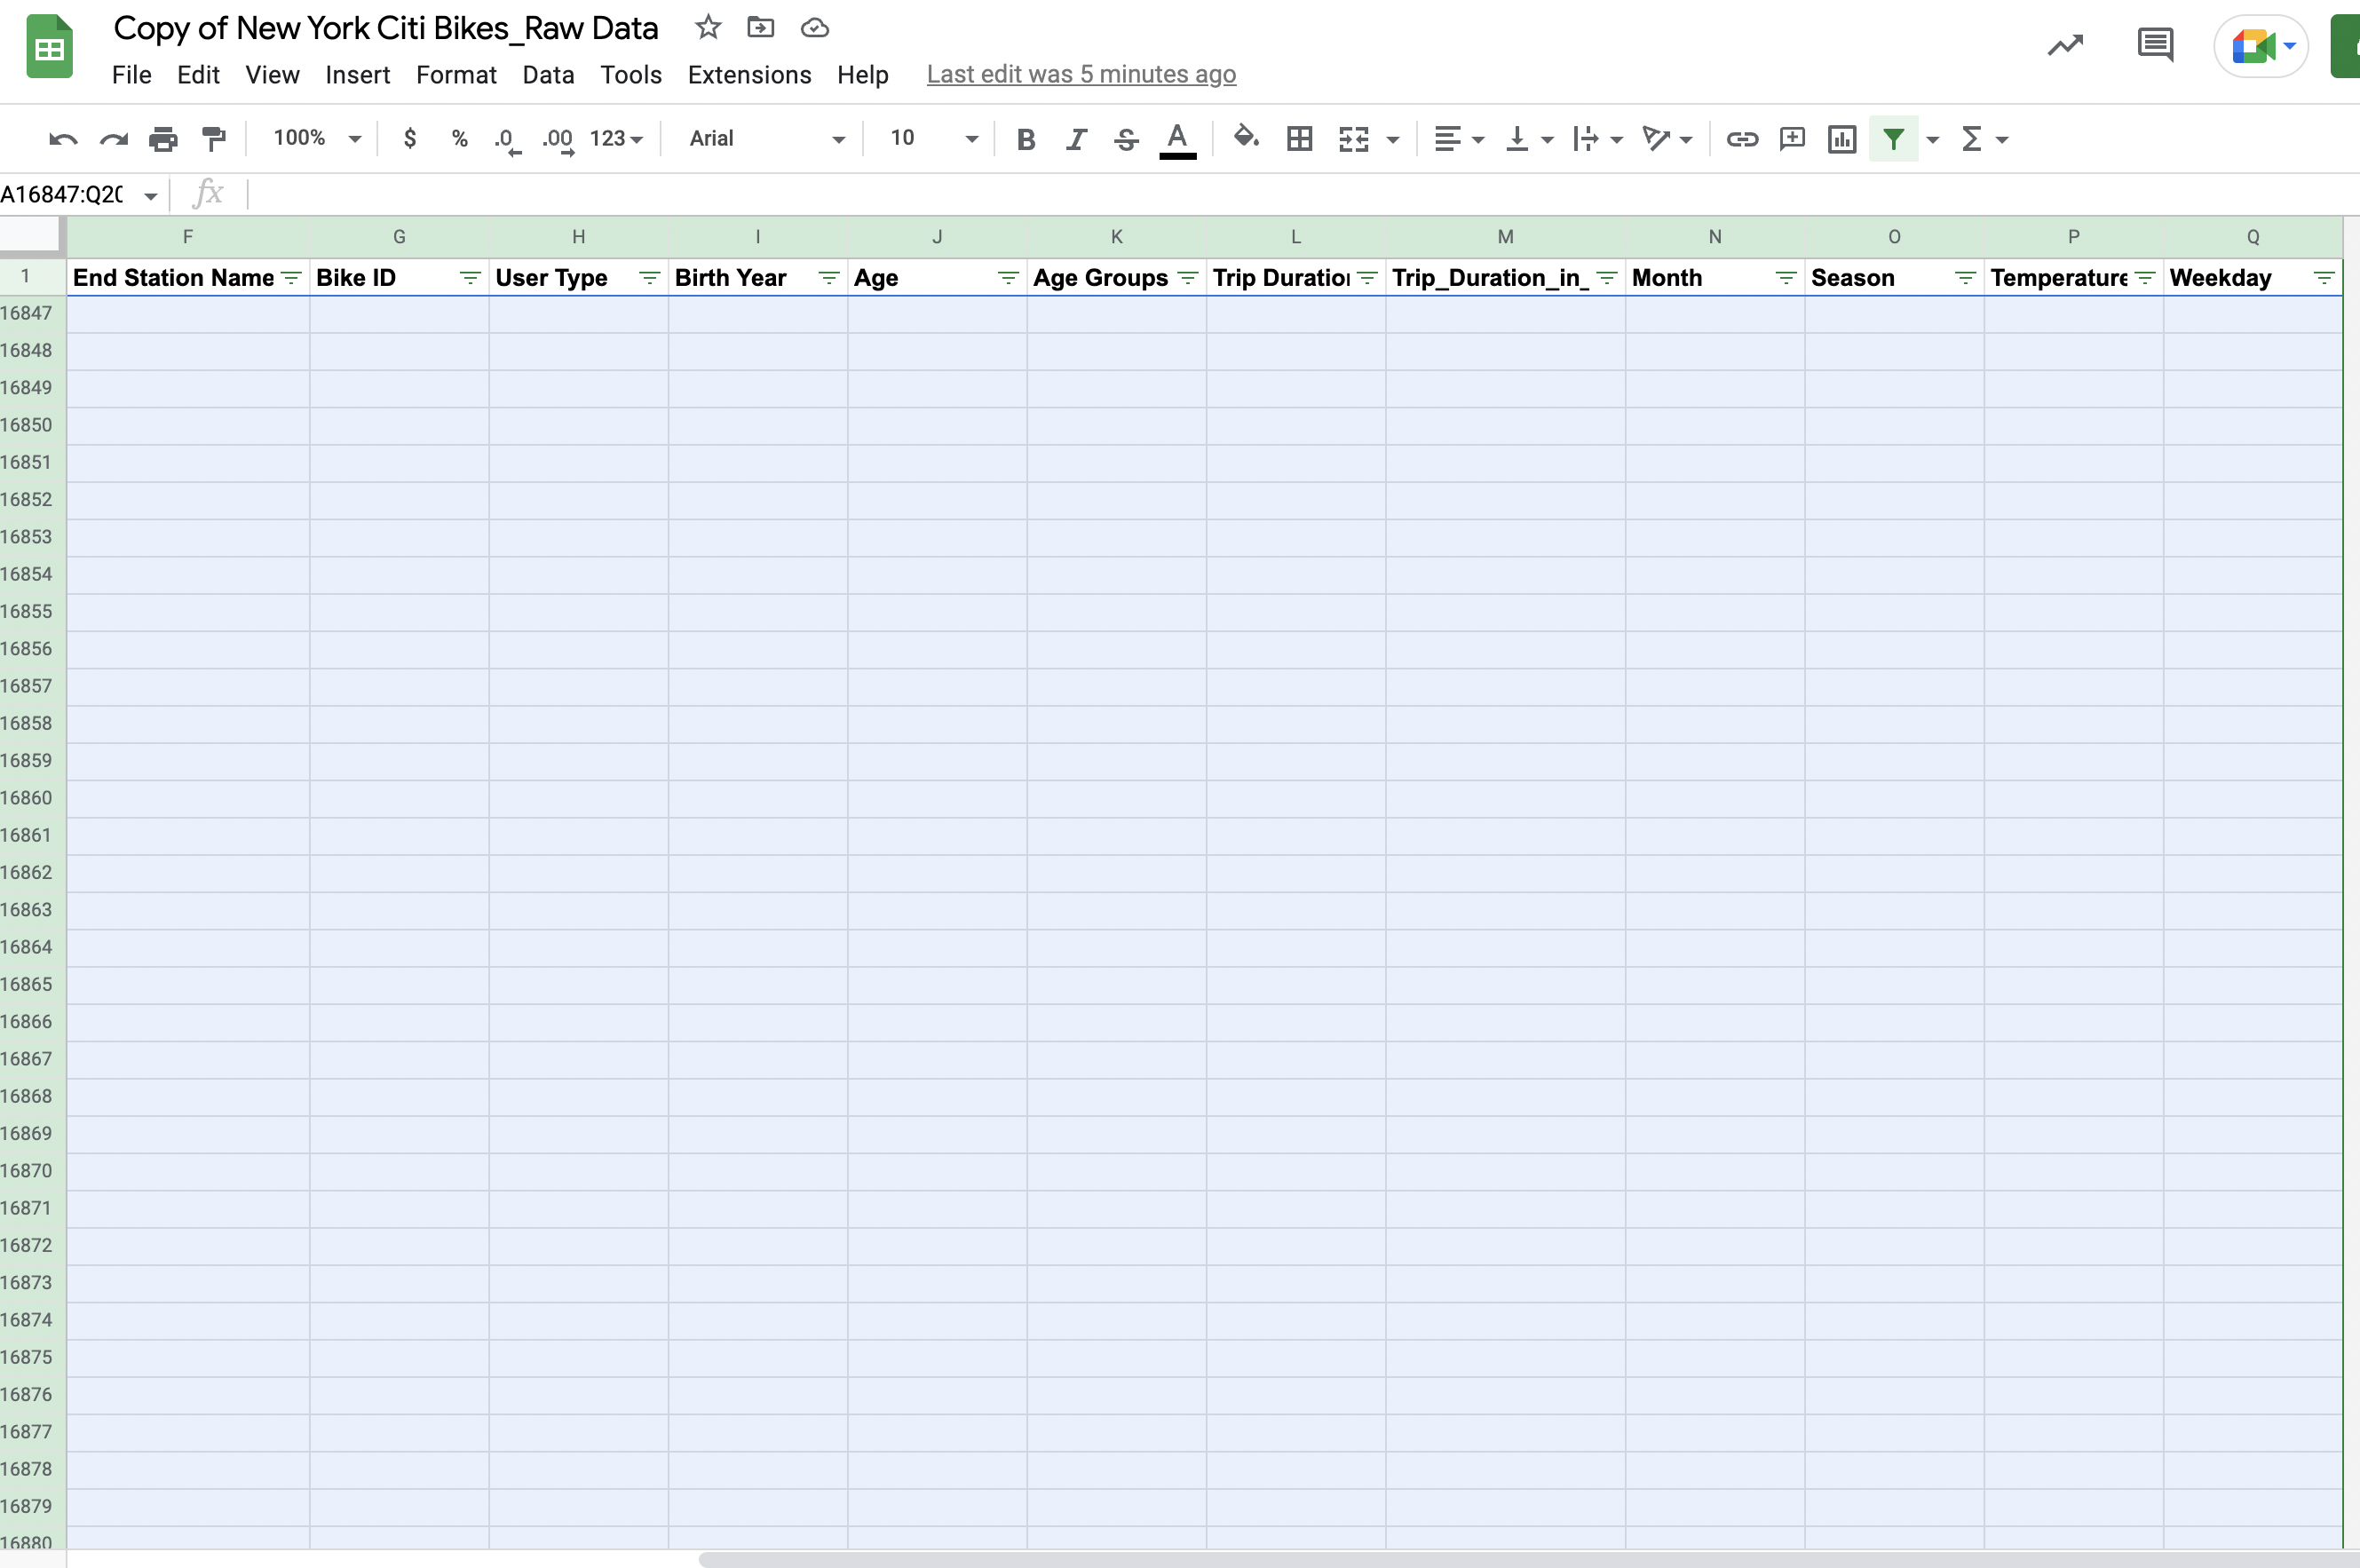
Figure 9. -
With your selection highlighted, right click and then select “Delete selected rows” from the drop-down menu:
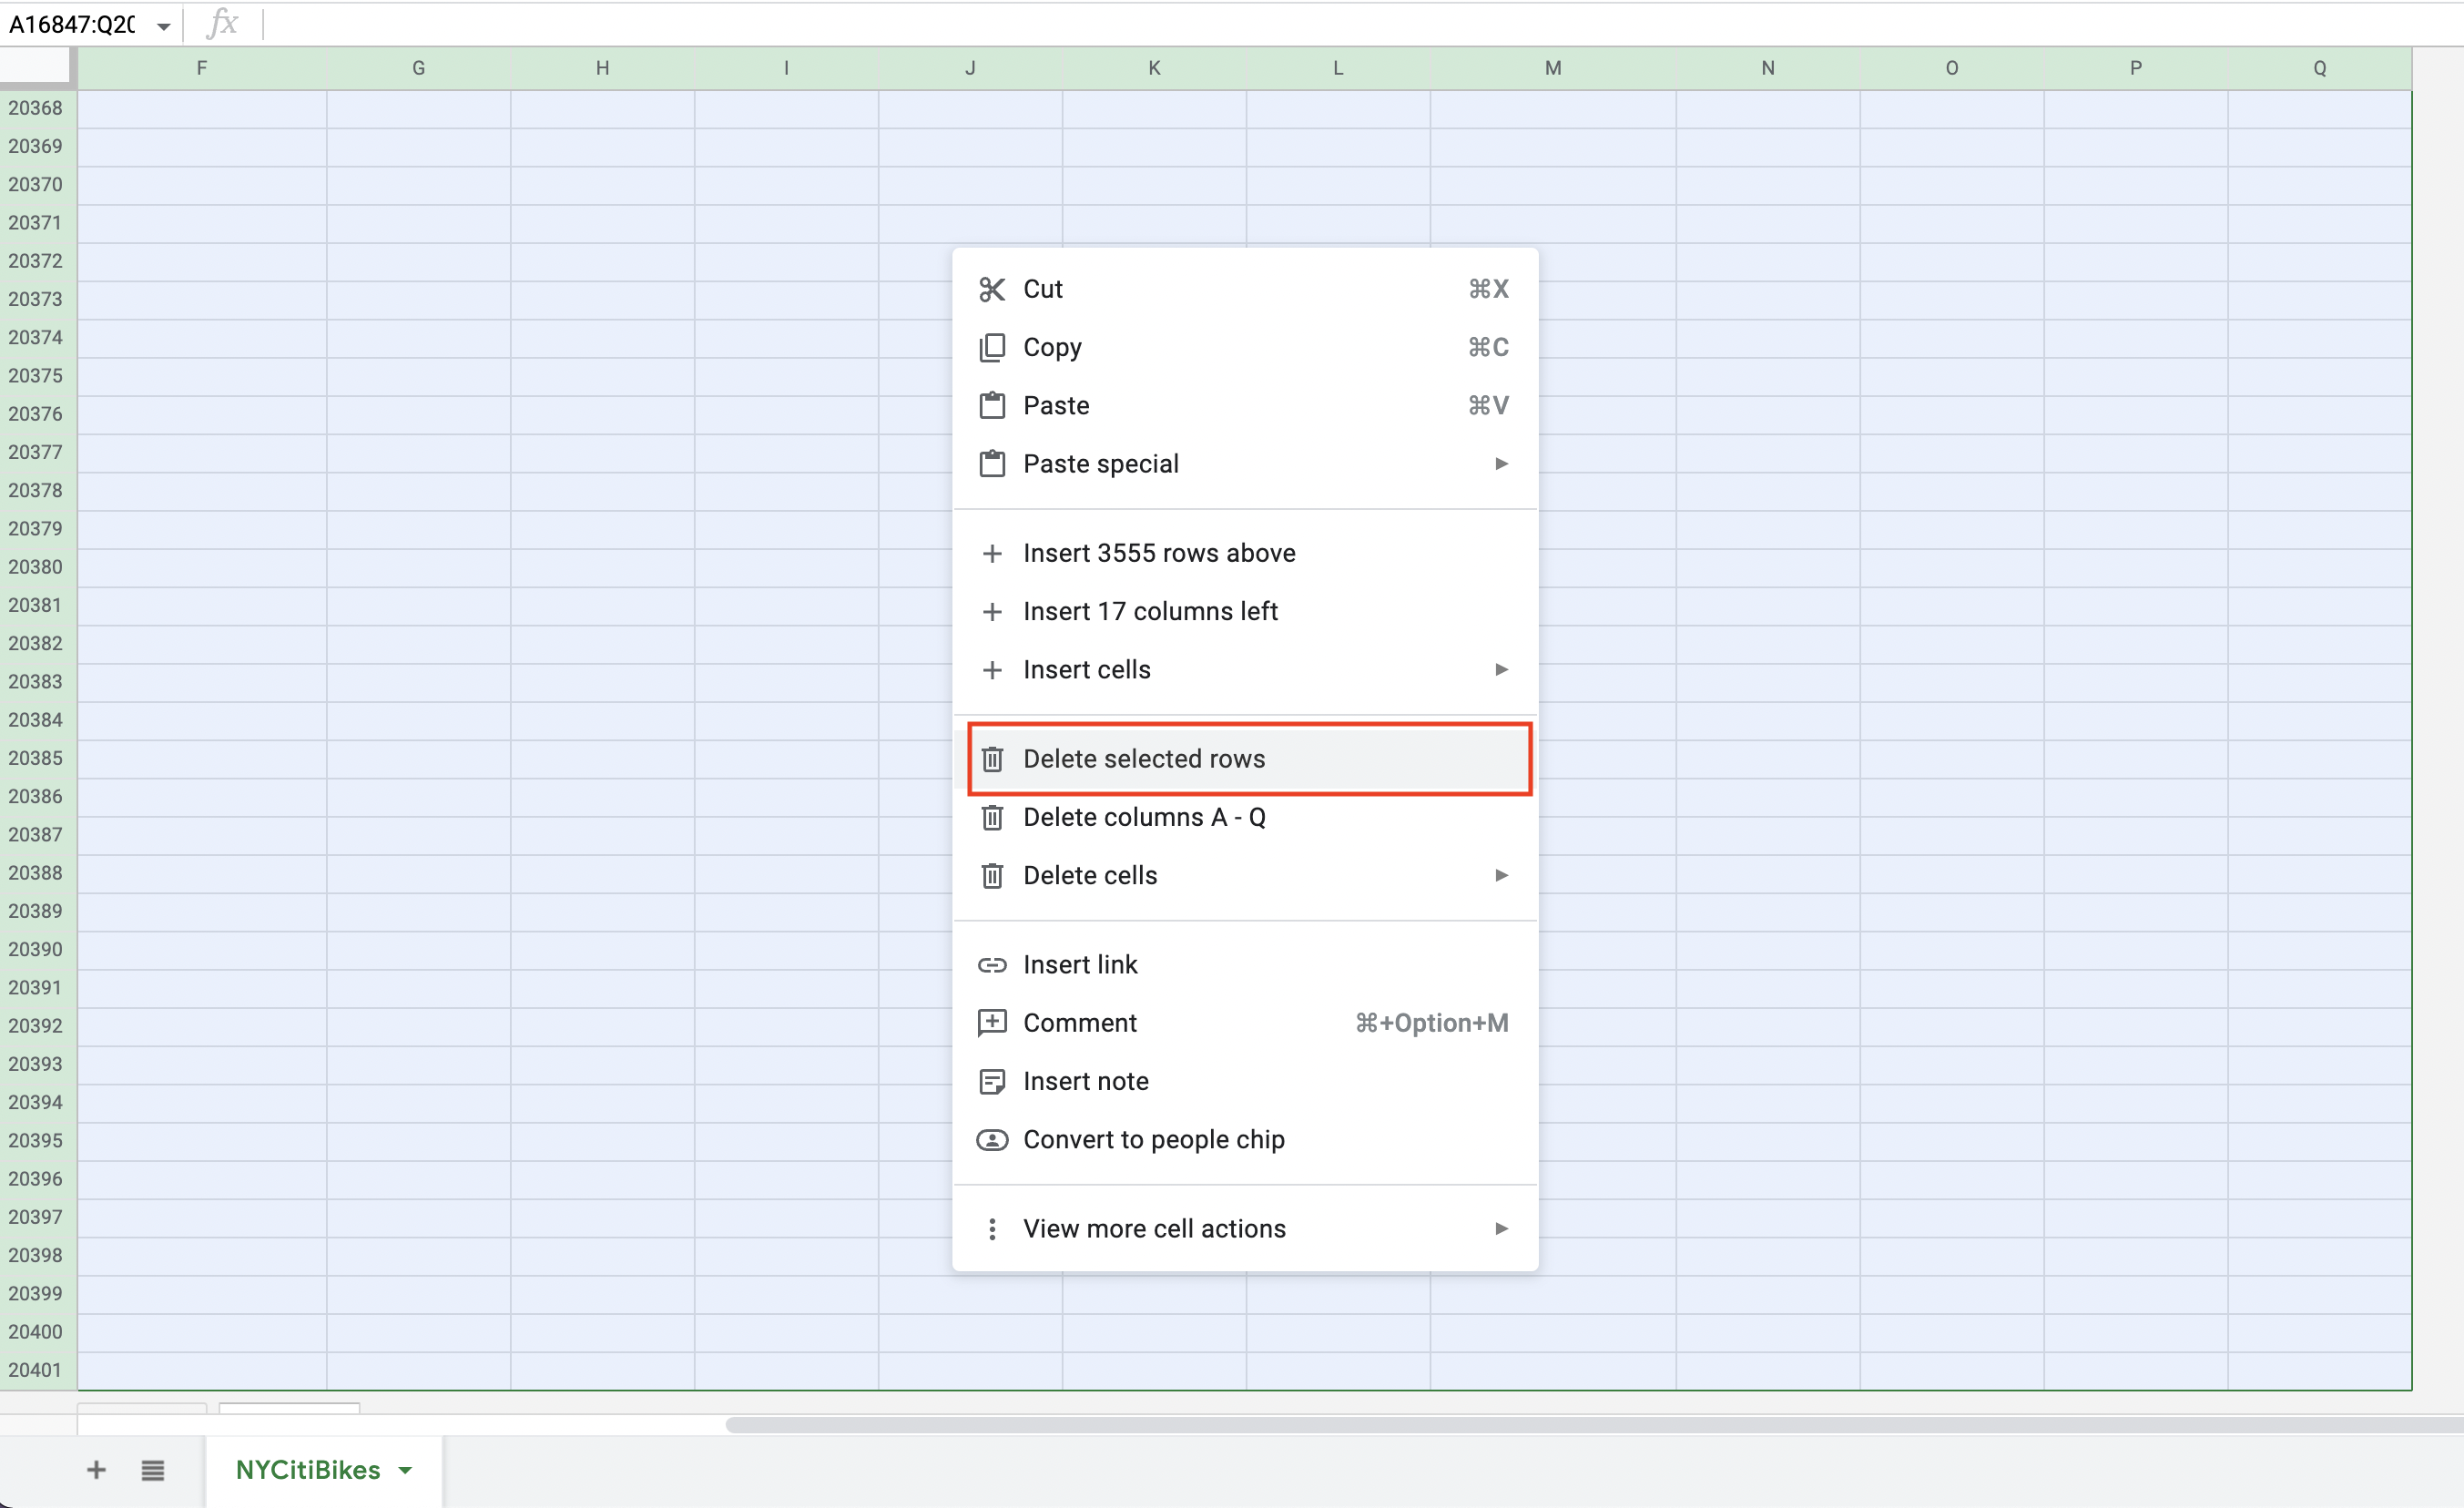
Figure 10.
Great! Now you’ve tidied up your dataset, ready to proceed to the next step of data cleaning. First, though, you’ll need to turn off the filter as you now want to return to the “normal” view of your data. So: -
Click “Data” in the top toolbar and select “Turn off filter” from the drop-down menu:
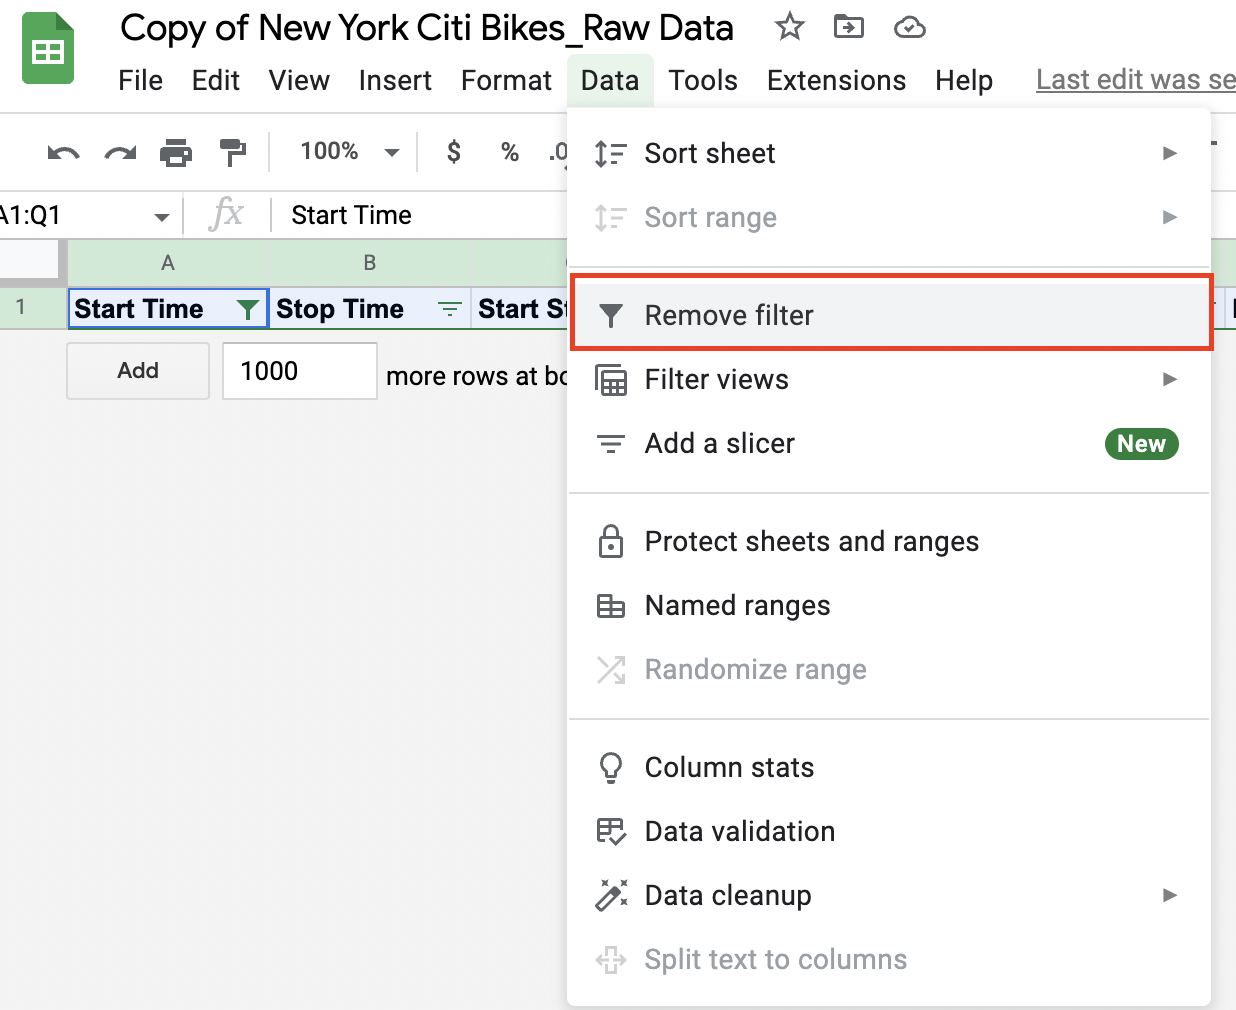
Figure 11.
You should now be able to see all your data again. Proceed to task 2! 😀
Task 2: Identify and remove missing data points
As we learned earlier, there are different ways to handle missing data. For our Citi Bike dataset, we’ll look at just one option: deleting all rows in your spreadsheet that contain missing values.
It’s important to bear in mind that this is not the only solution for handling missing data—nor is it necessarily always the best approach. For now, though, it will give us a clean dataset without needing to get into anything too complicated. This is a gentle introduction, after all! If you’re curious, you can learn about alternative methods for handling missing data here.
So, let’s get started!
First, we need to find the rows in our dataset that contain missing data (i.e. blank cells). There are a few ways to do this but we’re going to use the filter method.
Note: This is different to what we did in the previous step. In the previous step, we wanted to find entire blank rows that had been left behind when we deleted our duplicate rows. Now, we want to find individual blank cells within rows that otherwise contain data.
Usually, you would need to filter each column individually to check for blanks. For the purpose of this exercise (and to save you a bit of time), we can tell you that the missing data points are located in column F (End Station Name). So: Let’s create a filter that will show us only the missing values in our column of interest. Then we’re simply going to delete these rows.
- Select the column you want to check for missing values by clicking on the letter above the header. In our NY Citi Bike dataset, this is column F, “End Station Name.” So let’s select column F:
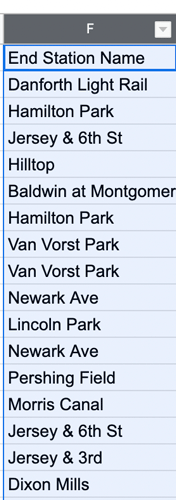
Figure 12. - With the column selected, we’re now going to create a filter. To do so, click the “Data” menu on the ribbon and select “Create a filter” from the drop-down:
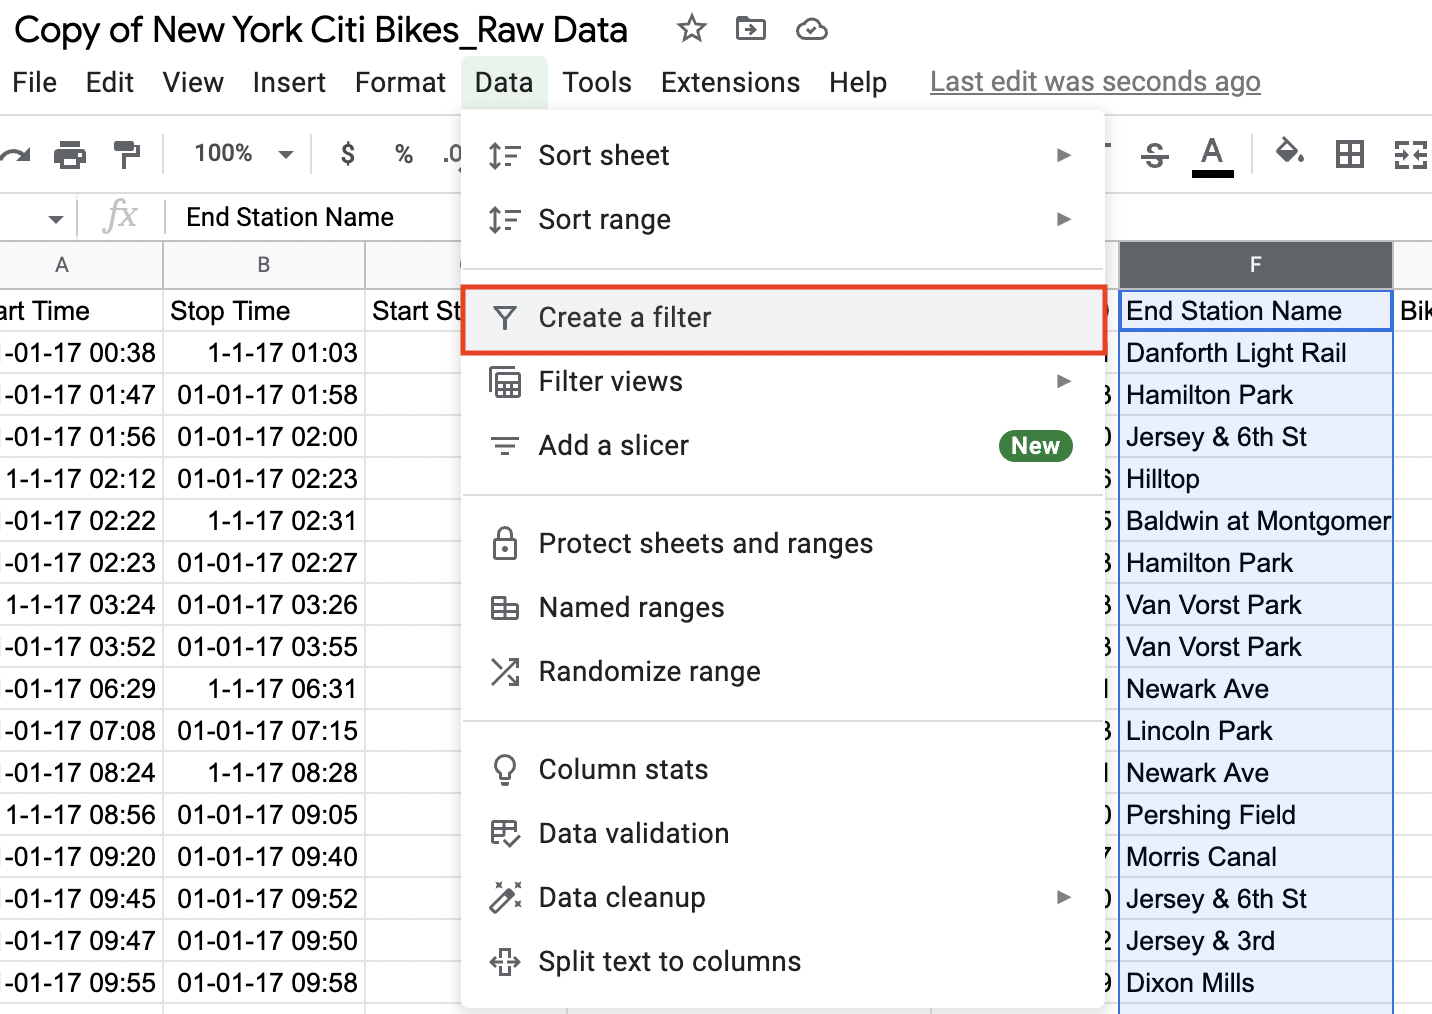
Figure 13. - Visibly, this won’t do much apart from creating a small funnel button next to the column name. Click on this filter icon to open up the filter options menu.
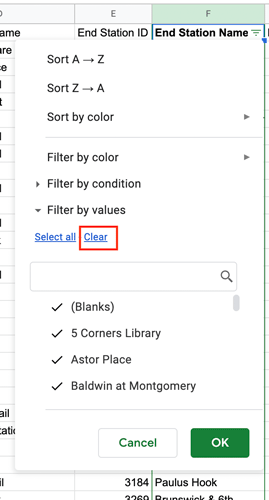
Figure 14.
Here, you can choose how to filter your data (just as we did before). For our dataset, we need to highlight any missing values, so we want the filter to pick out the empty cells. In Google Sheets (and in Microsoft Excel), these empty cells are called “Blanks.”
In figure 14, you can see that all of the values in column F are currently selected by the filter. To reset the selection (so you’re only highlighting the empty cells), click “Clear” and then select the “(Blanks)” category. A tick should appear next to it.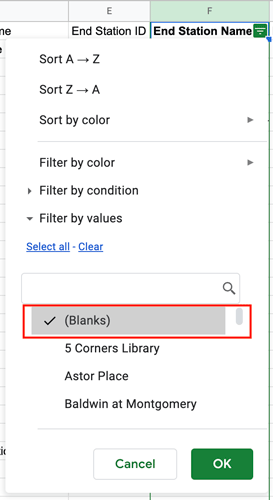
Figure 15. - Click “OK” to apply the filter. You’ll now see just a few rows of data, all of which contain a missing value! These are the rows we’re going to delete. Select all the rows, then right-click and select “Delete selected rows” from the drop-down menu:
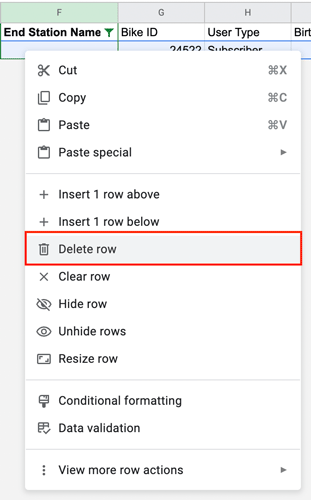
Figure 16. - As a final step, you’ll need to remove the filter you created as you no longer need it. To remove the filter, navigate to the “Data” tab again (in the top toolbar) and select “Remove filter”:
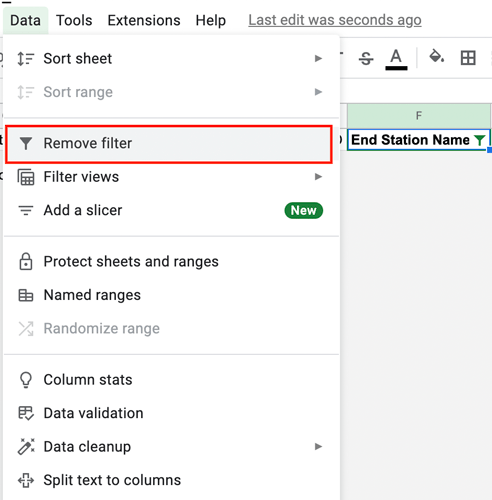
Figure 17.
This will restore all the other rows of data and return to a “normal” view of your dataset.
*Note: There are are few different ways to remove blanks. Another way is to apply conditional formatting to “color” blank cells so they’re more visually noticeable, or you can apply a filter to each column in your dataset and filter for “blanks.”
Hooray! You now have a clean dataset. You know what that means, right? You’re ready to start analyzing your data🕺Roll on the next tutorial!
3. Key takeaways and further reading
And that’s a wrap! In this tutorial, we’ve learned all about data cleaning and why it’s so important, and we’ve cleaned our dataset—ready for some exploratory analysis.
In the next tutorial, we’ll get descriptive statistics from our dataset in order to uncover some initial insights into how people are using the NY Citi Bike service 📈 If you’re not familiar with descriptive statistics, don’t worry—we’ll explain all.
You can learn more about the fascinating world of data in these posts:
- What is data quality and why does it matter?
- What is the difference between structured and unstructured data?
- What are the four levels of data measurement? Nominal, ordinal, interval, and ratio data explained
See you in tutorial three! 👋